Overview
The Overview page gives you a holistic look at how your app is performing, complete with easy-to-find key metrics and top-level campaign data.
Once you've logged into Superwall, you'll be taken to the Overview page. Here, you can view key metrics and important campaign performance about your app.
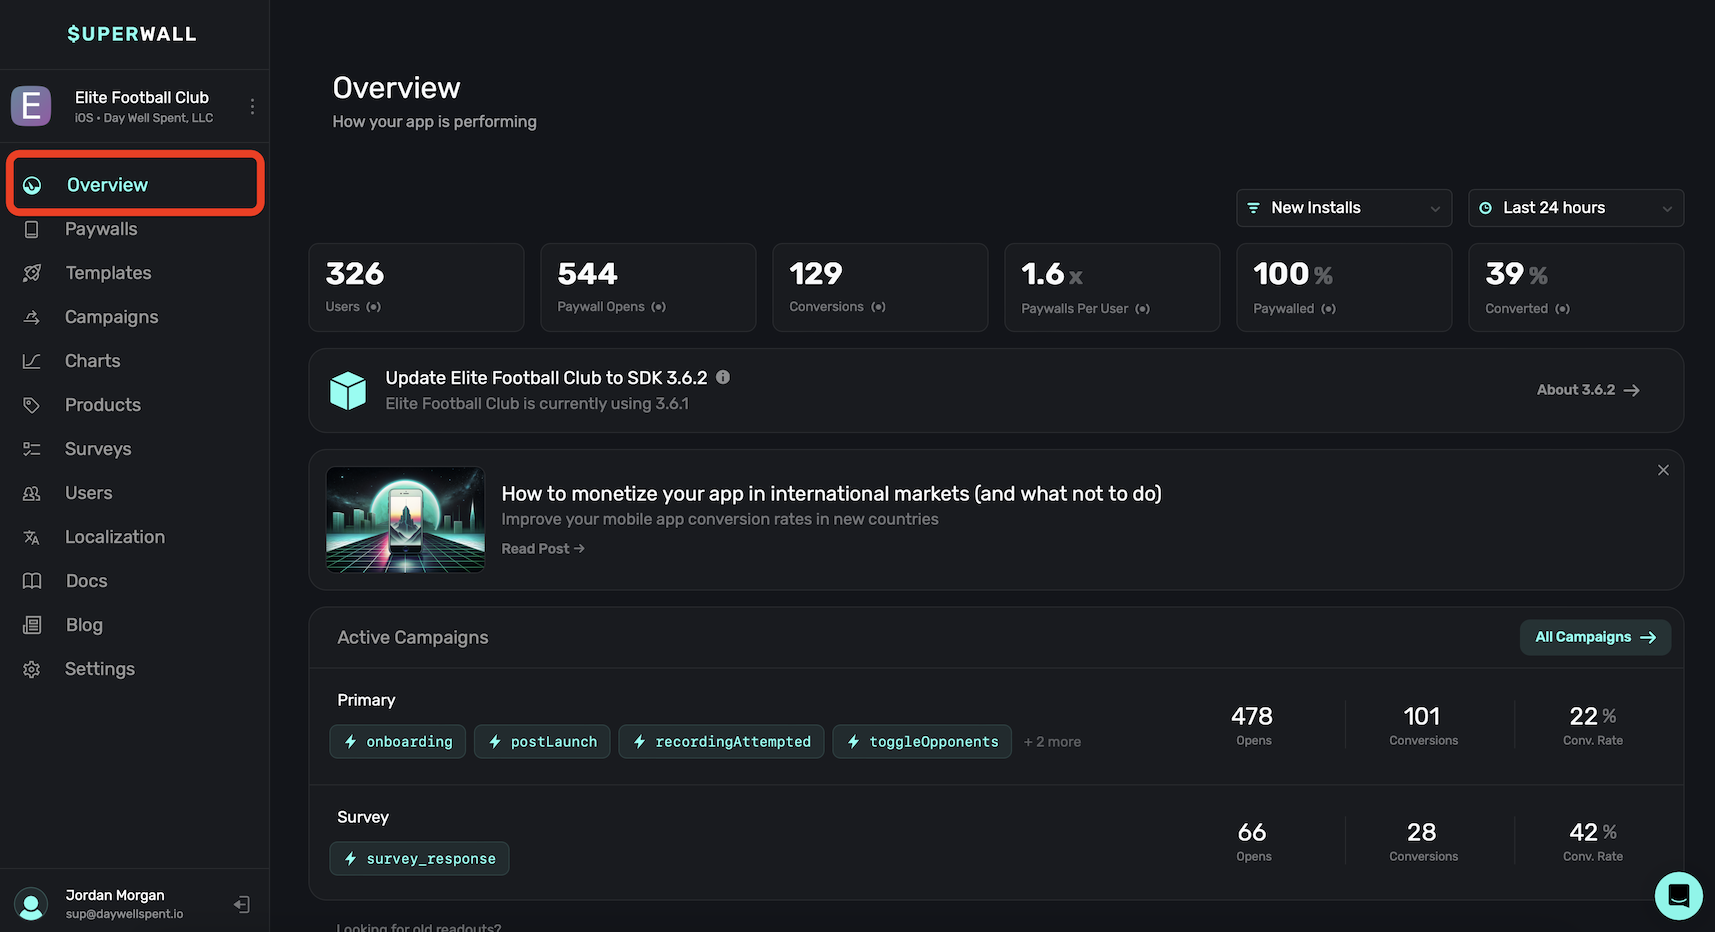
You can toggle between your other apps to view with the Overview page too. Just use the toggle at the top left to choose another app.
Quickstart
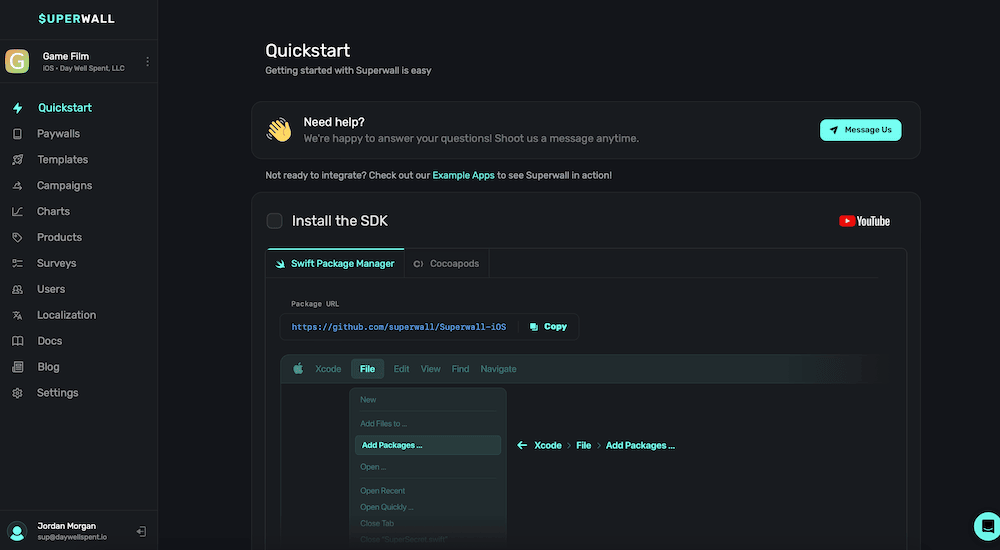
When you log in for the first time or add a new app, the Overview page displays a Quickstart wizard to help you get up and running. Complete the interactive checklist to finish your Superwall integration:
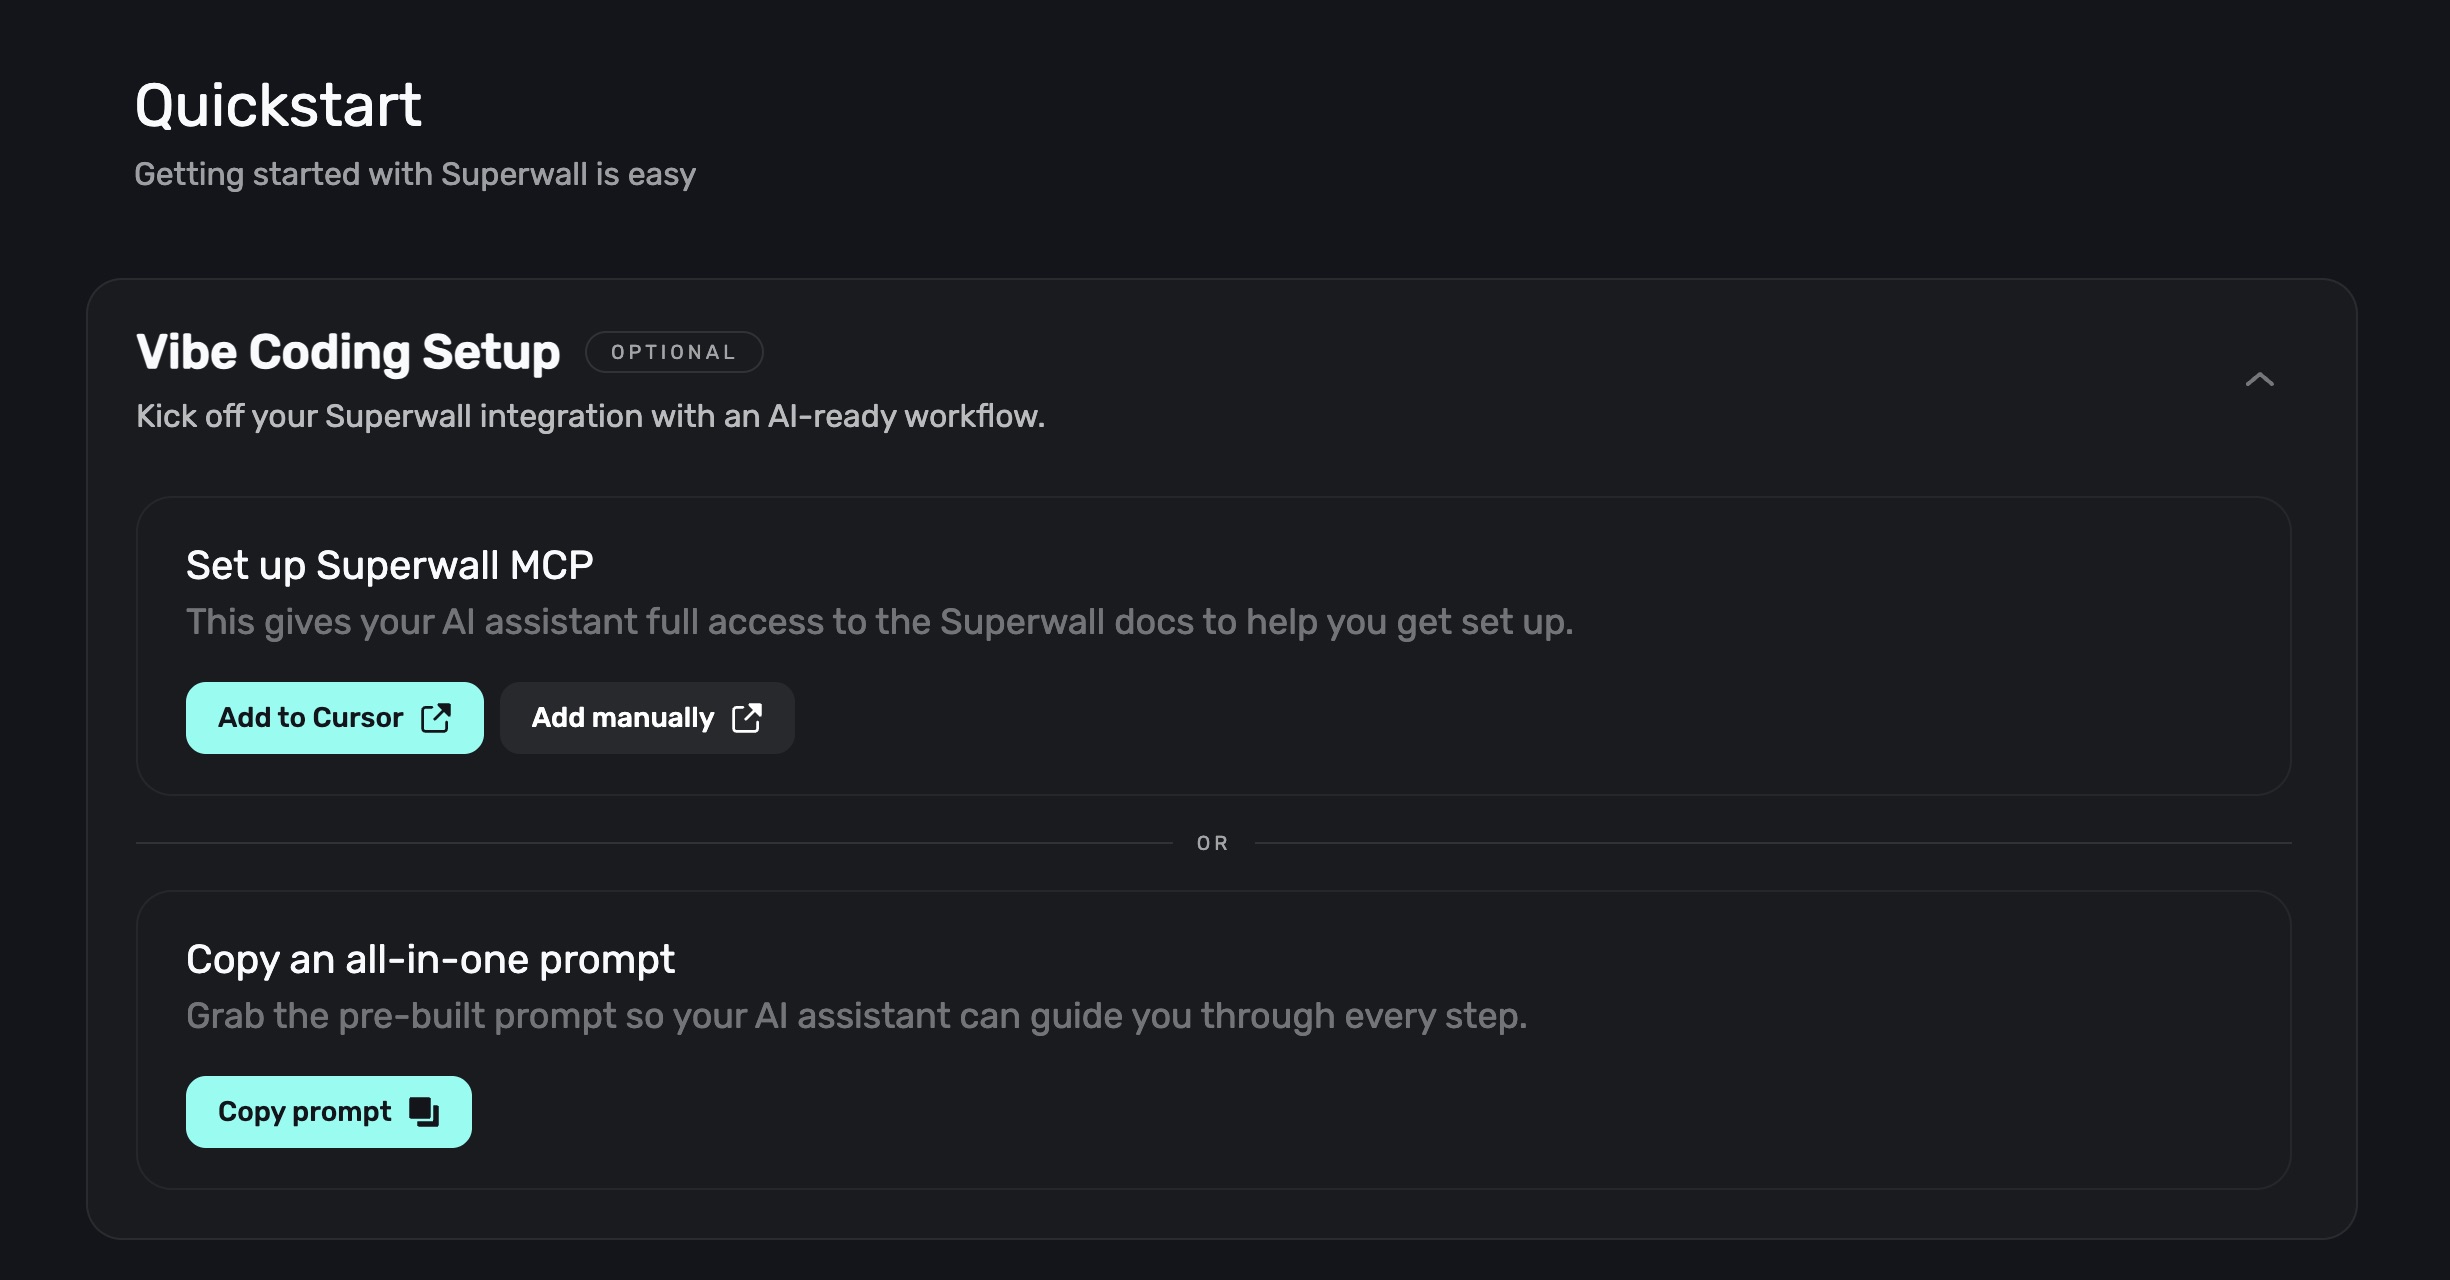
You can also get started with AI using our MCP and prompts:
Dashboard sections
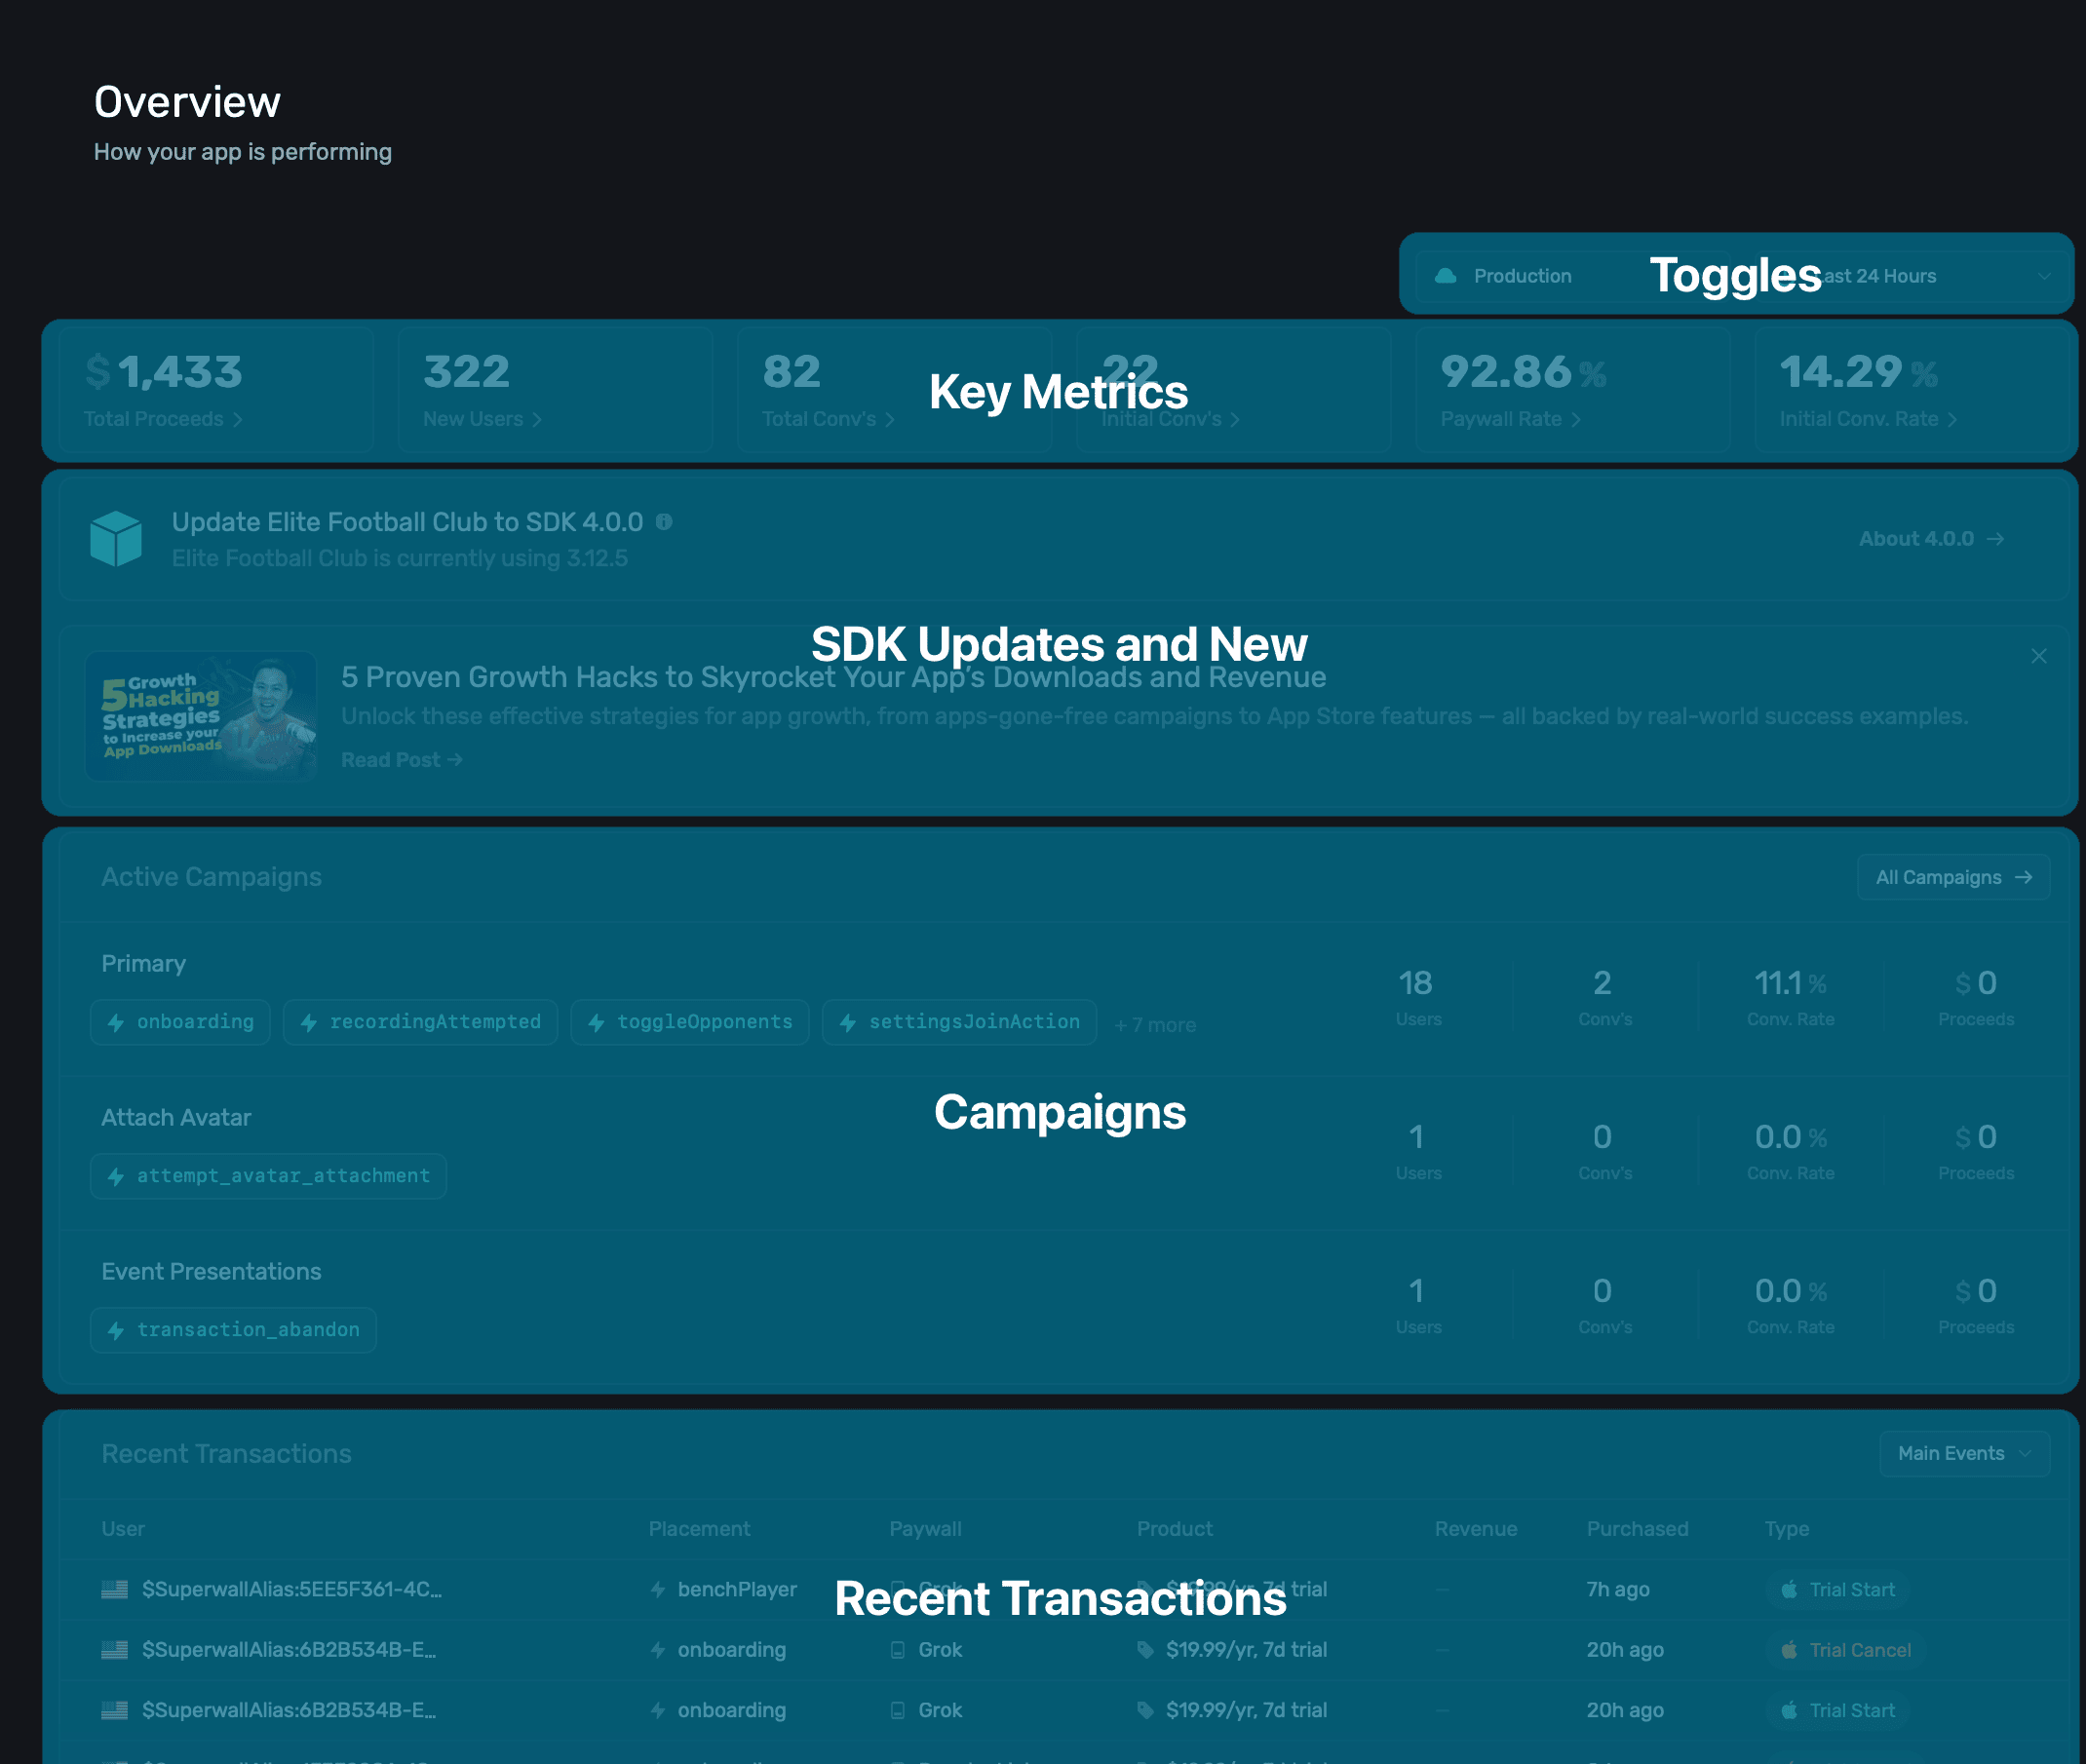
The overview dashboard is broken down between five main sections:
- Toggles: Switch between new install or all users, and apply different time filters between them.
- Key Metrics: Critical data about how your app is performing.
- SDK Alerts & News: Alerts about new SDK versions available and company news.
- Campaigns: Breakdowns of your active campaigns.
- Recent Transactions: Displays the most recent transactions from the selected app.
New installs versus all users
Using the toggles at the top, you can switch between viewing data about New Installs or All Users, along with changing date ranges between either of them:
Here's the difference between New Installs and All Users:
- New Installs: Represents users who installed your app within the selected time frame.
- All Users: Represents any user of your app, including returning and new users.
Changing dates
Use the toggles at the top to change date ranges:
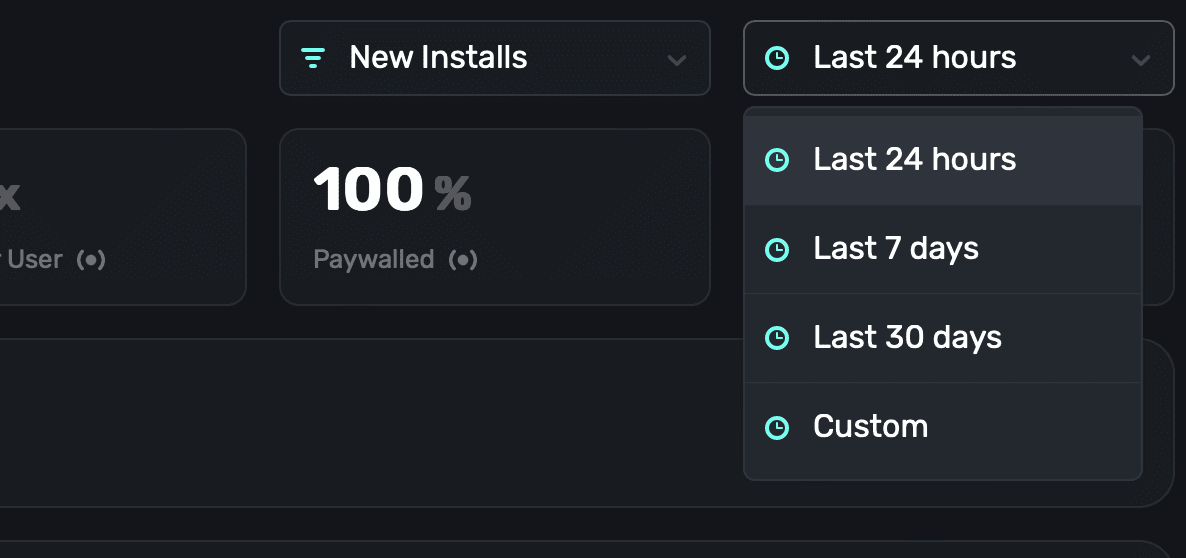
All of the key metrics and campaign data will be updated based on the range you select. If you need fine-grain control, choose Custom and choose any date range you like.
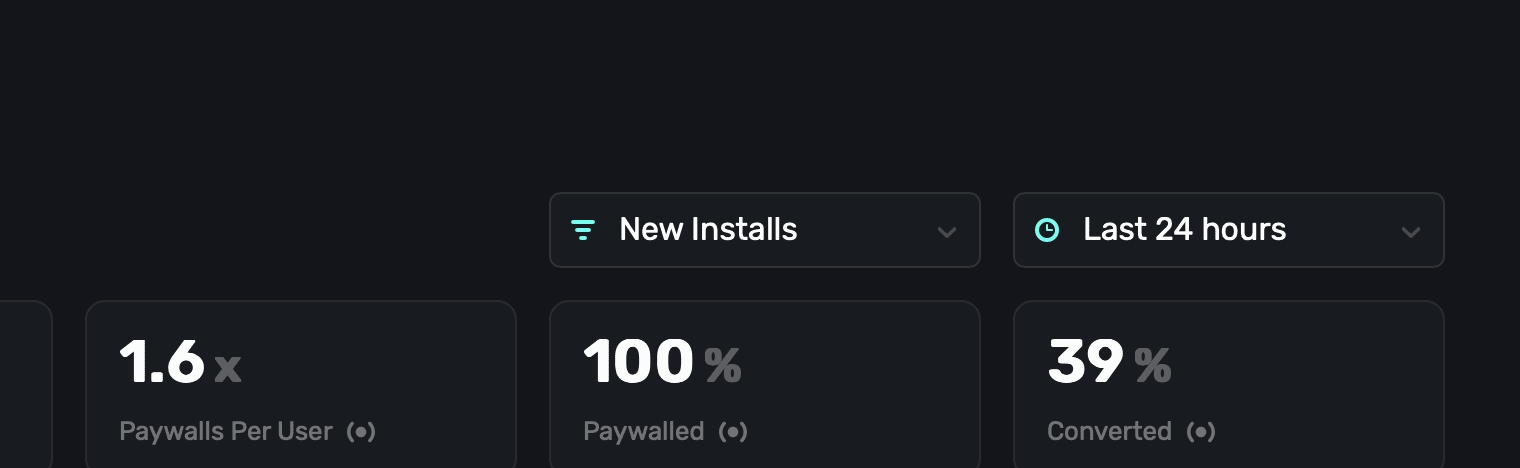
Key metrics
View insightful metrics at the top of the overview page:
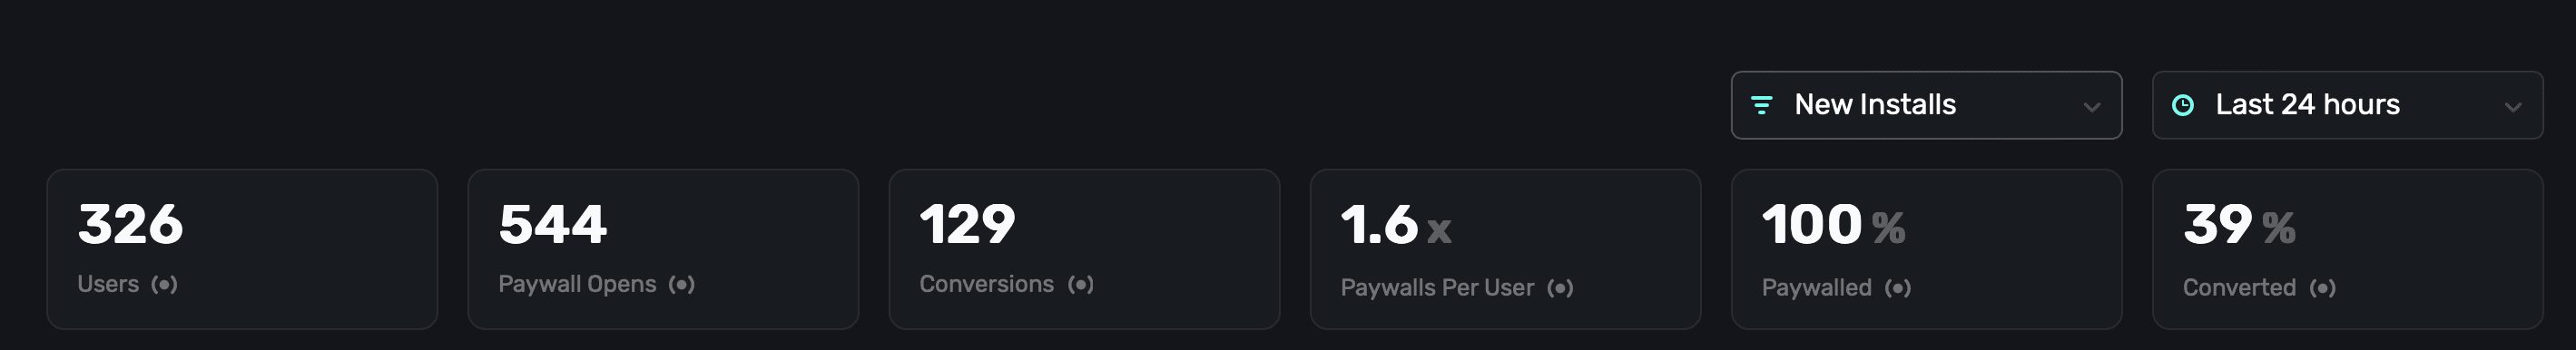
Here's what they mean, from left-to-right:
| Name | Description |
|---|---|
| Users | The number of unique users who opened your app. |
| Paywall Opens | How many paywall presentations occurred. |
| Conversions | A total number of Conversions resulting from a presented paywall. |
| Paywalls Per User | The percentage of paywalls shown per user. Remember, each user may see more than one paywall per session. |
| Paywalled | The percentage of how many users were shown a paywall in total. |
| Converted | The percentage of users who converted (trial or paid). |
Use these metrics as a way to quickly get a sense of how your app is performing from a monetization standpoint.
Campaigns
The active campaigns section gives you a quick overview of how your selected app's campaigns are performing:
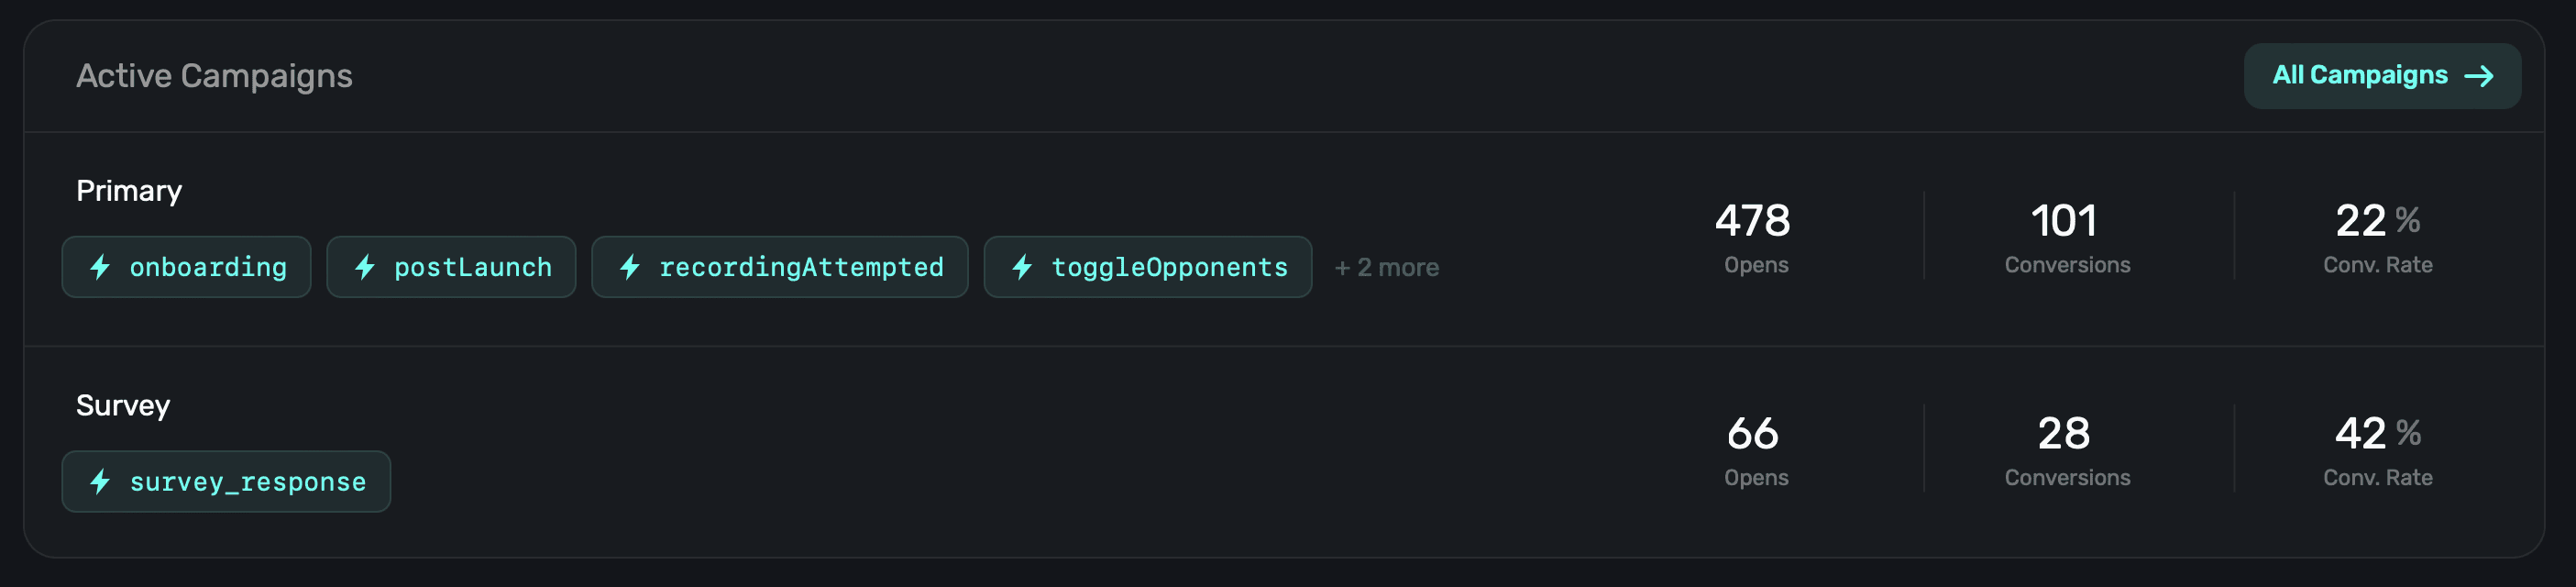
For each campaign, Superwall will show:
- The placements in-use by the campaign.
- How many opens those placements resulted in. Put differently, how many paywall presentations have occurred for the campaign.
- How many conversions the campaign has produced.
- The conversion rate the campaign currently holds.
Like the metrics section, all the data here is representative of the users or new installs and time frame you've chosen from the toggles at the top of the Overview page.
Click on any campaign to dig deeper into them. If you would like to view all campaigns (active or paused), click All Campaigns at the top-right. Learn more about campaign here.
Recent transactions
To view recent transactions from your app, use the "Recent Transactions" view:
The transaction view displays:
- User: The user ID the event belongs to, along with an emoji flag representing their territory. Click on this value to quickly copy it to your clipboard.
- Placement: The placement that the event associates to. You can click this to open the campaign that the placement belongs to.
- Paywall: The paywall that the event took place on. Click this value to quickly open a modal preview of the paywall.
- Product: The product the event represents. Hover over this value to get a tooltip that will display the product's identifier.
- Revenue: Any revenue generated from the event.
- Purchased: The time the event occurred.
- Type: The event type. The list of events can be found below.
Keep in mind that Superwall displays transaction events based on the moment a server notification is received from the relevant store front. That means that the timing of the event may not necessarily be right when it actually occurred.
Transaction event types
Each of the following transaction types can show up in the transaction view:
| Event Name | Description |
|---|---|
| Main Events (Default) | A collection of key subscription events for tracking purposes. |
| All Events | Includes every possible subscription-related event for complete tracking. |
| Paywall Conversion | Triggered when a user successfully converts or starts a trial via a paywall. |
| Trial Start | Indicates the beginning of a free trial period. |
| Direct Sub Start | A subscription starts without a trial period. |
| One Time Purchase | A non-subscription, single-payment transaction is completed. |
| Intro Offer | A user subscribes using an introductory offer. |
| Trial Convert | A trial that successfully converted into a paid subscription. |
| Renewal | An existing subscription renews for another billing period. |
| Refund | A user is refunded for a previous purchase. |
| Trial Cancel | A user cancels their trial before it converts to a paid subscription. |
| Trial Expire | A free trial ends without converting to a paid subscription. |
| Cancel | A user cancels their active subscription. |
| Uncancel | A previously canceled subscription is reactivated before expiration. |
| Expire | A subscription fully expires and is no longer active. |
You can filter the transaction view by any of these using the toggle at the top right:
If you see the paywall or placement values blank — don't worry. This means the user started a subscription, reactivated or whatever the event may be out outside of your app. Typically, this occurs when they visit their Apple ID's settings and change subscription or products there manually. Further, processing simply represents just that — Superwall received an event, but some of the details are still being fetched. Typically, this shouldn't make more than a few minutes.
How is this guide?