Paywall Experimentation System: A Free Notion Template Built on 100+ Tests
A structured system for organizing and prioritizing paywall experiments, based on 100+ tests run at Mojo.
Running paywall experiments sounds simple. Pick a hypothesis, build a variant, measure what happens.
In practice, it gets messy fast.
Ideas pile up across Slack and sticky notes. Two tests run on the same audience at the same time. A winning variant from three months ago that nobody documented properly. A backlog of 40 ideas with no clear sense of what's worth running next.
I've been there. At Mojo, I ran over 100 paywall and growth experiments across iOS and Android: price tests, layout changes, special offers, copy tweaks, market-by-market rollouts. Early on, we didn't have a real system. Good ideas got lost. Post-mortems were inconsistent. Results lived in someone's head.
So, I built a board in Notion to fix that (get it here):
It helped us stay organized, move faster, and (I believe) contributed to the 60% ARPU growth we achieved in just five months.
Now at Superwall, I've turned that board into a free template. Here's what's inside and how to use it.
Why a system matters
Paywall optimization isn't a one-off project. It's an ongoing process. The teams that get the best results aren't necessarily the smartest. They're the ones who test consistently, document everything, and build on what they've learned.
A structured approach keeps your team aligned, ensures you're focused on high-impact experiments, and prevents you from repeating the same mistakes. Without it, even good teams lose momentum.
What the template does
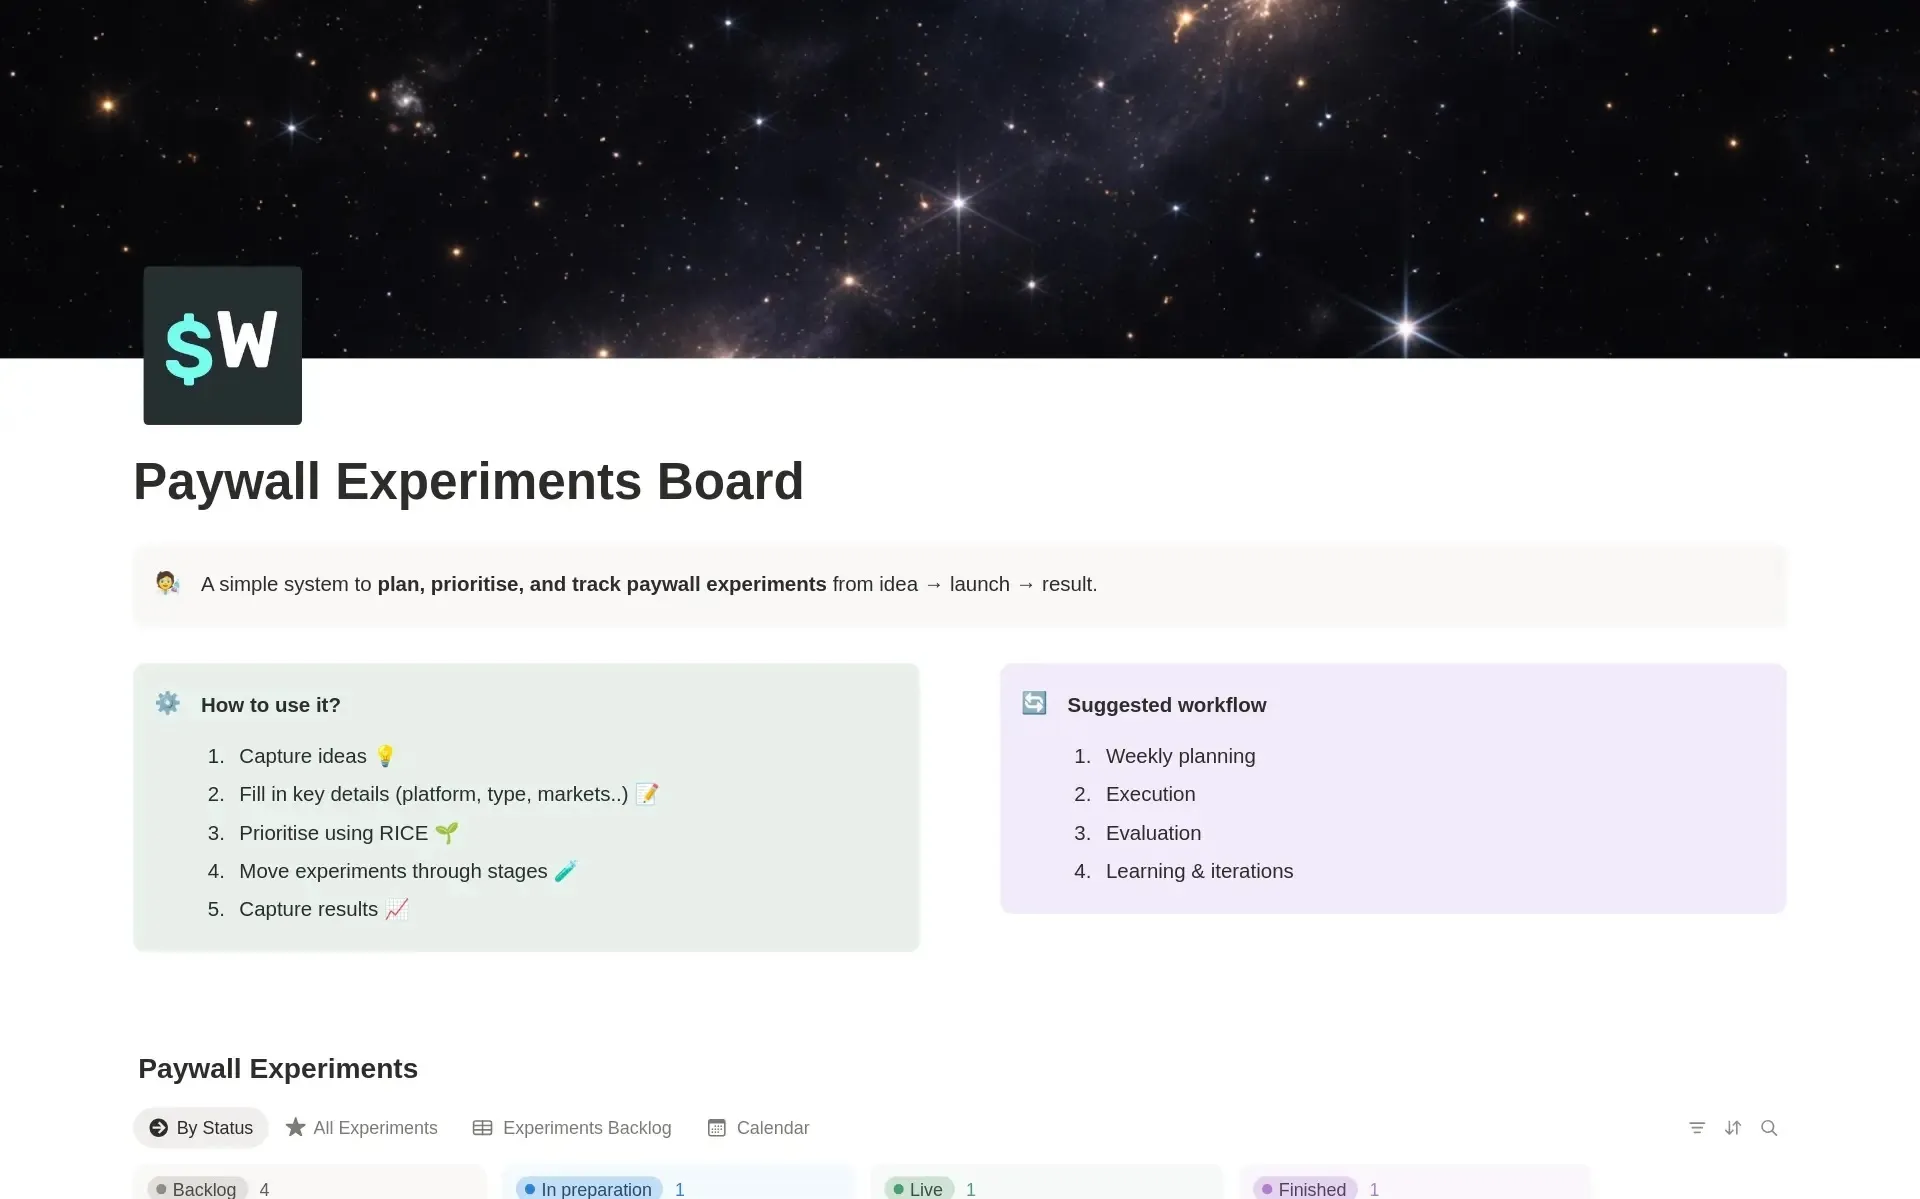
The Paywall Experiments Board is a single Notion database that tracks experiments from first idea to final result. It gives you three things:
- A clear view of what's live, what's in the pipeline, and what's in the backlog.
- A structured way to prioritise ideas using RICE scoring.
- A record of every experiment you run, so learnings compound over time.
It's intentionally simple. No complex automations. Just a clean system that keeps your experimentation work organized.
What's inside
The experiment database: Each row is one experiment. Here's what you track (feel free to adjust to your needs!).
The basics:
- Experiment name and ID — a clear label and unique number to reference experiments across docs, analytics, and reports.
- Status — moves through four stages: Backlog → In Preparation → Live → Finished.
- Assignee and Team — who owns it (Engineering, Product, Growth, or CEO).
- Type — Special Offer, Pricing, Layout, or Copy/Assets.
- Platform — iOS, Android, or both.
- Country — global or market-specific (12 country options included).
- Start and end dates — so you always know what's running and when it wraps up.
Prioritization: RICE scoring: Before anything moves out of the backlog, score it on four dimensions (each 1–10):
- Reach — how many users will this affect?
- Impact — if it works, how much will it move the needle?
- Confidence — how sure are you it'll work?
- Effort — how much work does it take to build and run?
The RICE Score and Priority fields calculate automatically once you fill in the numbers. No manual ranking needed.
In my experience, Reach often has the biggest influence on the overall score — it represents the potential audience for each experiment, which matters a lot when deciding what to prioritize.
Results: Once an experiment finishes, log the outcome: Winner, Flat, or Failure. Link your report. Over time, this becomes one of the most valuable assets your team has — a living record of what works and what doesn't.
The views: Four pre-built views:
- By Status (Board) — a Kanban grouped by stage. Your day-to-day view.
- All Experiments (Table) — every experiment, every field. Good for reviews and retrospectives.
- Experiments Backlog (Table) — your ideas pipeline, where prioritization happens.
- Calendar — experiments by end date. Useful for avoiding overlap and planning around launches.

How to use it
The workflow is built around a five-step loop:
- Capture ideas freely: Add every idea to the backlog immediately: a new pricing tier, a different onboarding paywall, a seasonal offer. Don't filter at this stage. Getting ideas out of heads and into the board is the whole point.
- Fill in the details: For each idea, fill in the key fields: type, platform, market, owner. This forces clarity early and makes prioritisation much easier.
- Score with RICE: Score each idea on Reach, Impact, Confidence, and Effort. The RICE Score and Priority fields update automatically. Now you have a data-backed way to decide what runs next — not gut feel, not whoever shouted loudest in the last meeting.
- Move experiments through the stages: Backlog → In Preparation → Live → Finished. The board view makes it immediately obvious how many experiments are active at once, which helps you avoid overlap and manage capacity.
- Document the results: Mark as Finished, log the outcome, link the report. Patterns emerge over time. You stop repeating failed ideas. Winners get built on.
Who it's for
This template works well for:
- Indie developers and solo founders running their first paywall tests and wanting a lightweight system to stay organized.
- Small product or growth teams who need a shared source of truth for what's running and what's next.
- Anyone using Superwall who wants to pair their experimentation infrastructure with a planning and tracking layer.
You don't need 100 experiments under your belt to benefit from a system like this. The best time to set one up is before things get messy.
Get the template
The Paywall Experiments Board is free. Duplicate it into your Notion workspace and start using it.
→ Get the free Notion template
If you're running paywall experiments and want a more powerful infrastructure layer — analytics, targeting, remote config, A/B testing — that's what Superwall is built for. Sign up for free.
Built by Michal, based on a system that helped drive 60% ARPU growth at Mojo in five months. Now available for everyone.