Understanding Demand Score Insights
Learn how to read and interpret the charts and breakdowns on the Demand Score page, including conversion rates, volume, trial outcomes, and per-placement and per-country analysis.
The Demand Score page provides several charts and breakdowns to help you understand how demand score correlates with conversion behavior in your app. Each section is collapsible and includes explanatory notes directly below the chart.
Conversion rate
The Conversion Rate chart shows the observed conversion rate for each demand score bucket. Higher-demand buckets should generally have higher conversion rates. If they don't, it may point to a paywall or offer issue in that range.
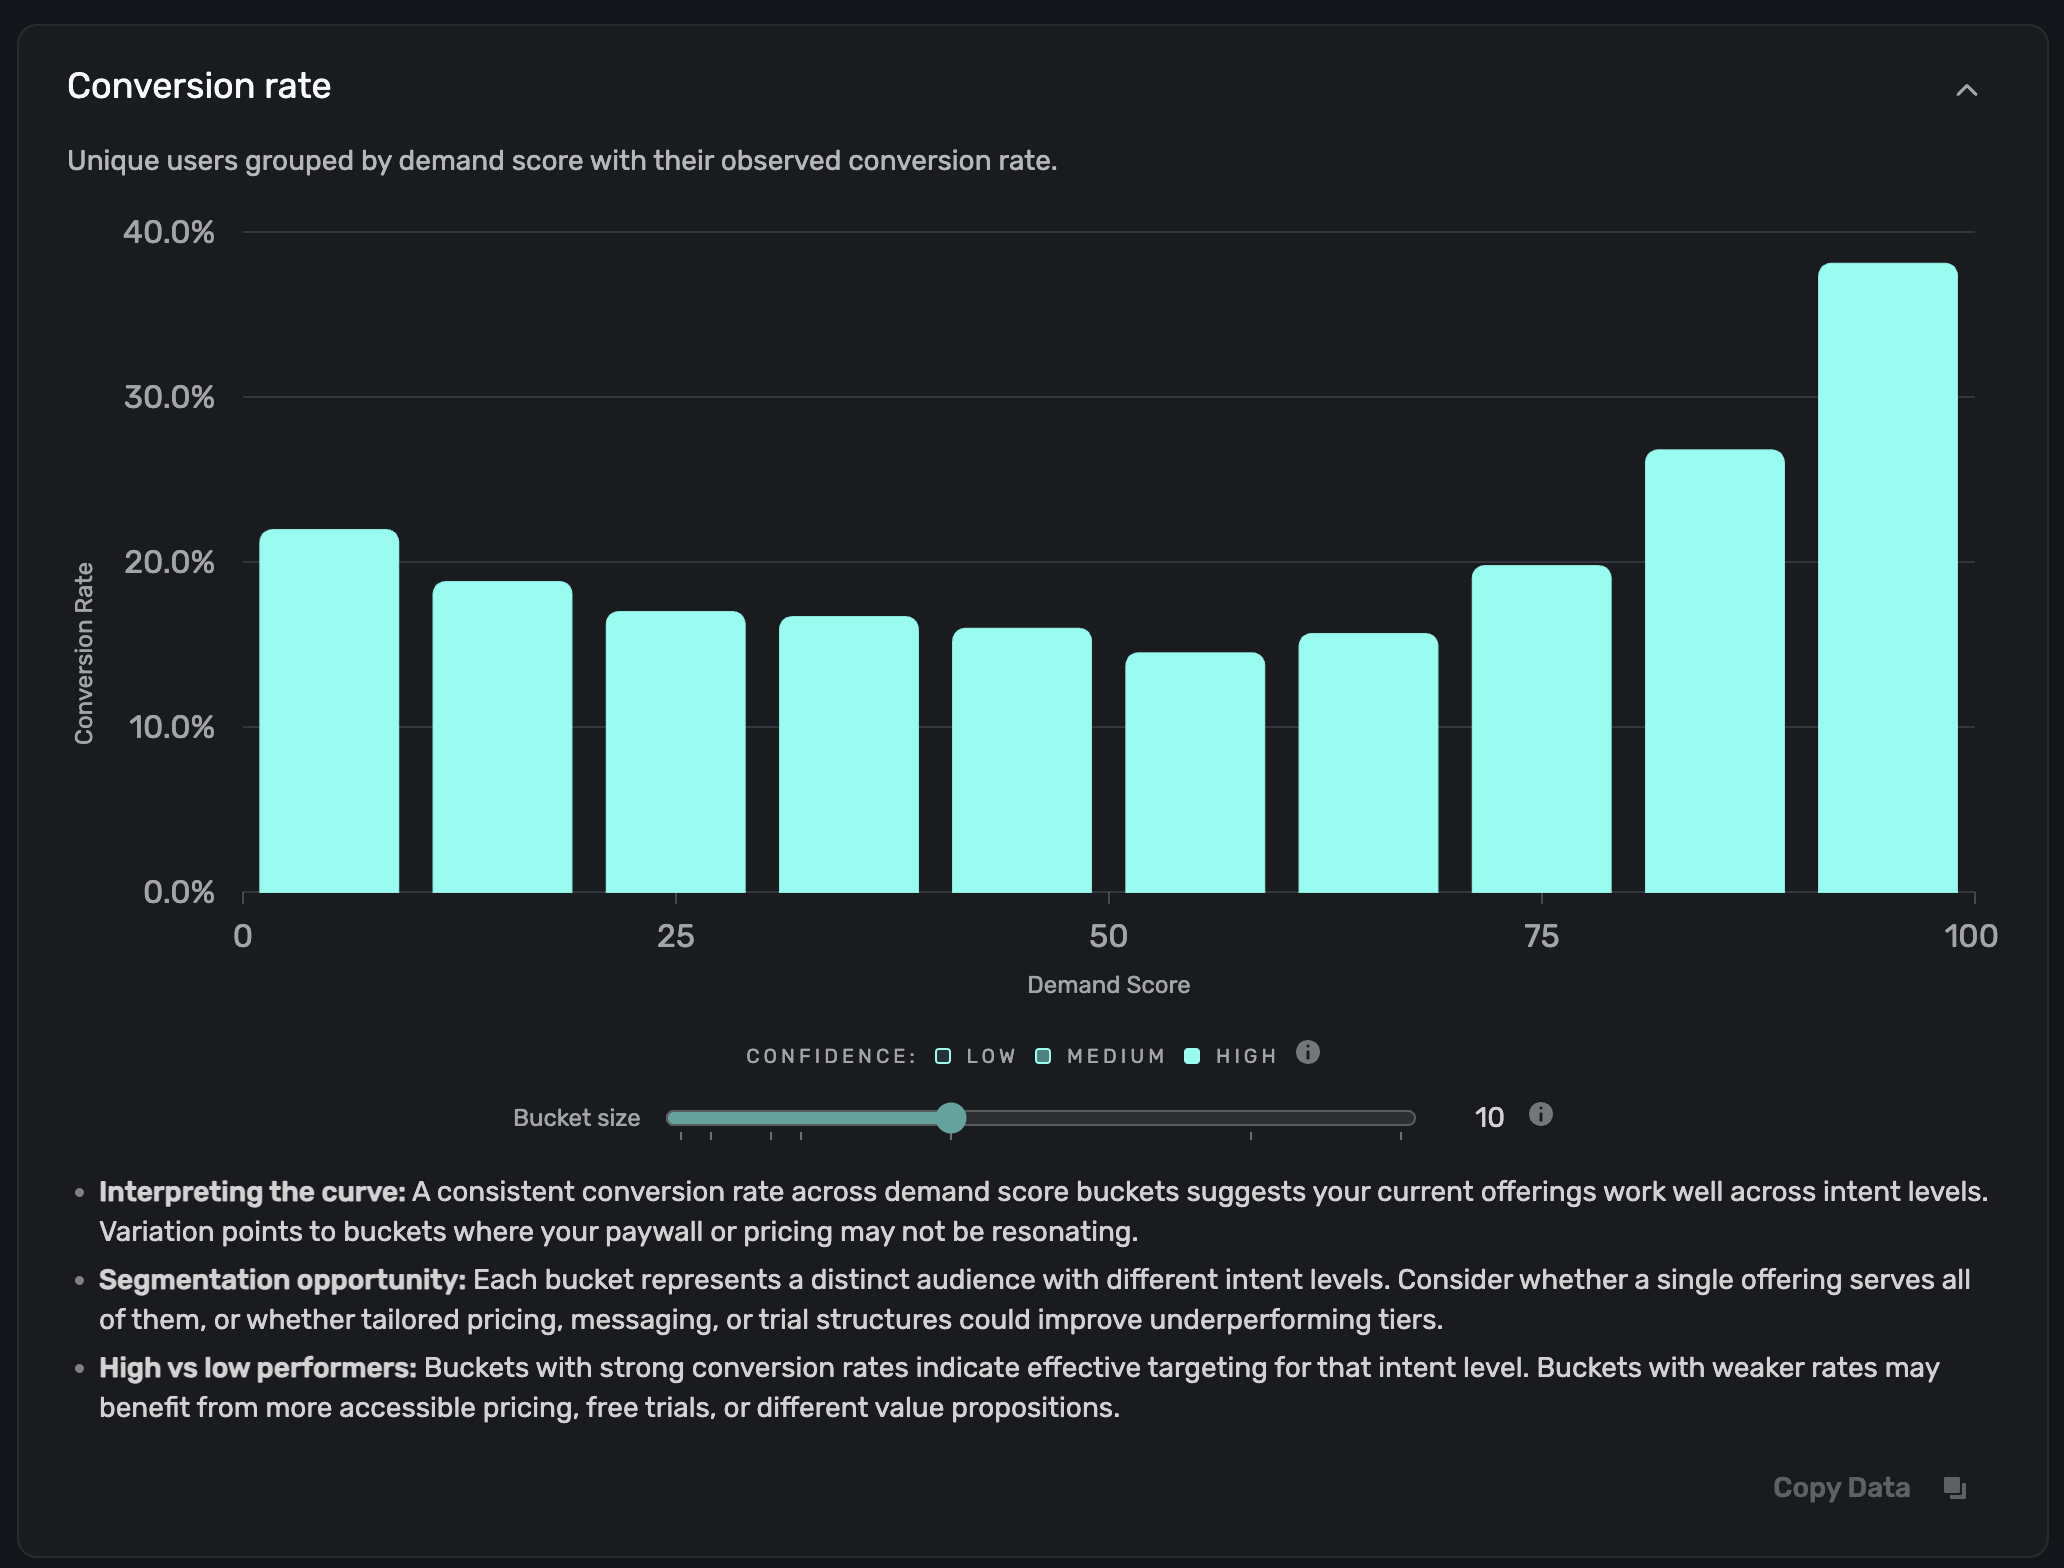
Each bar is shaded by confidence level based on the sample size in that bucket:
| Confidence | Meaning |
|---|---|
| High | Large sample size with a tight confidence interval. Reliable. |
| Medium | Moderate sample size. Directionally useful. |
| Low | Small sample or wide confidence interval. Interpret with caution. |
Look for variation points in the curve. Buckets where conversion drops unexpectedly may indicate that your paywall or pricing isn't resonating with that intent level.
Total paywalled users by conversion
This stacked bar chart shows the absolute number of users per demand score bucket, split into conversions and non-conversions:

Unlike the conversion rate chart (which normalizes by percentage), this view shows where your actual volume sits. A high-volume bucket with a low conversion rate represents more potential revenue impact than a low-volume bucket with the same rate.
Use this chart to:
- Identify where your users are concentrated. If most volume sits in the 80–100 range, your user acquisition is bringing in high-intent users.
- Prioritize experiments. A high-volume, low-conversion bucket is the highest-leverage place to test a new offer.
Trial conversion and billing issues
This stacked bar chart breaks down uncancelled trial outcomes by demand score bucket:

Each bar shows three outcome types:
| Outcome | Description |
|---|---|
| Trial conversion | Users who completed their trial and converted to a paid subscription without billing issues. |
| Billing issues (recovered) | Users who hit a payment problem on conversion but later recovered and converted. |
| Billing issues (unrecovered) | Users who hit a payment problem and did not convert. |
This chart helps you understand post-conversion behavior. If certain demand tiers show high billing issues or low trial conversion, consider adjusting trial length, payment timing, or trial-to-paid messaging for those segments.
Breakdown by placement
The Breakdown by Placement table shows how demand score and conversion vary across each of your paywall placements:
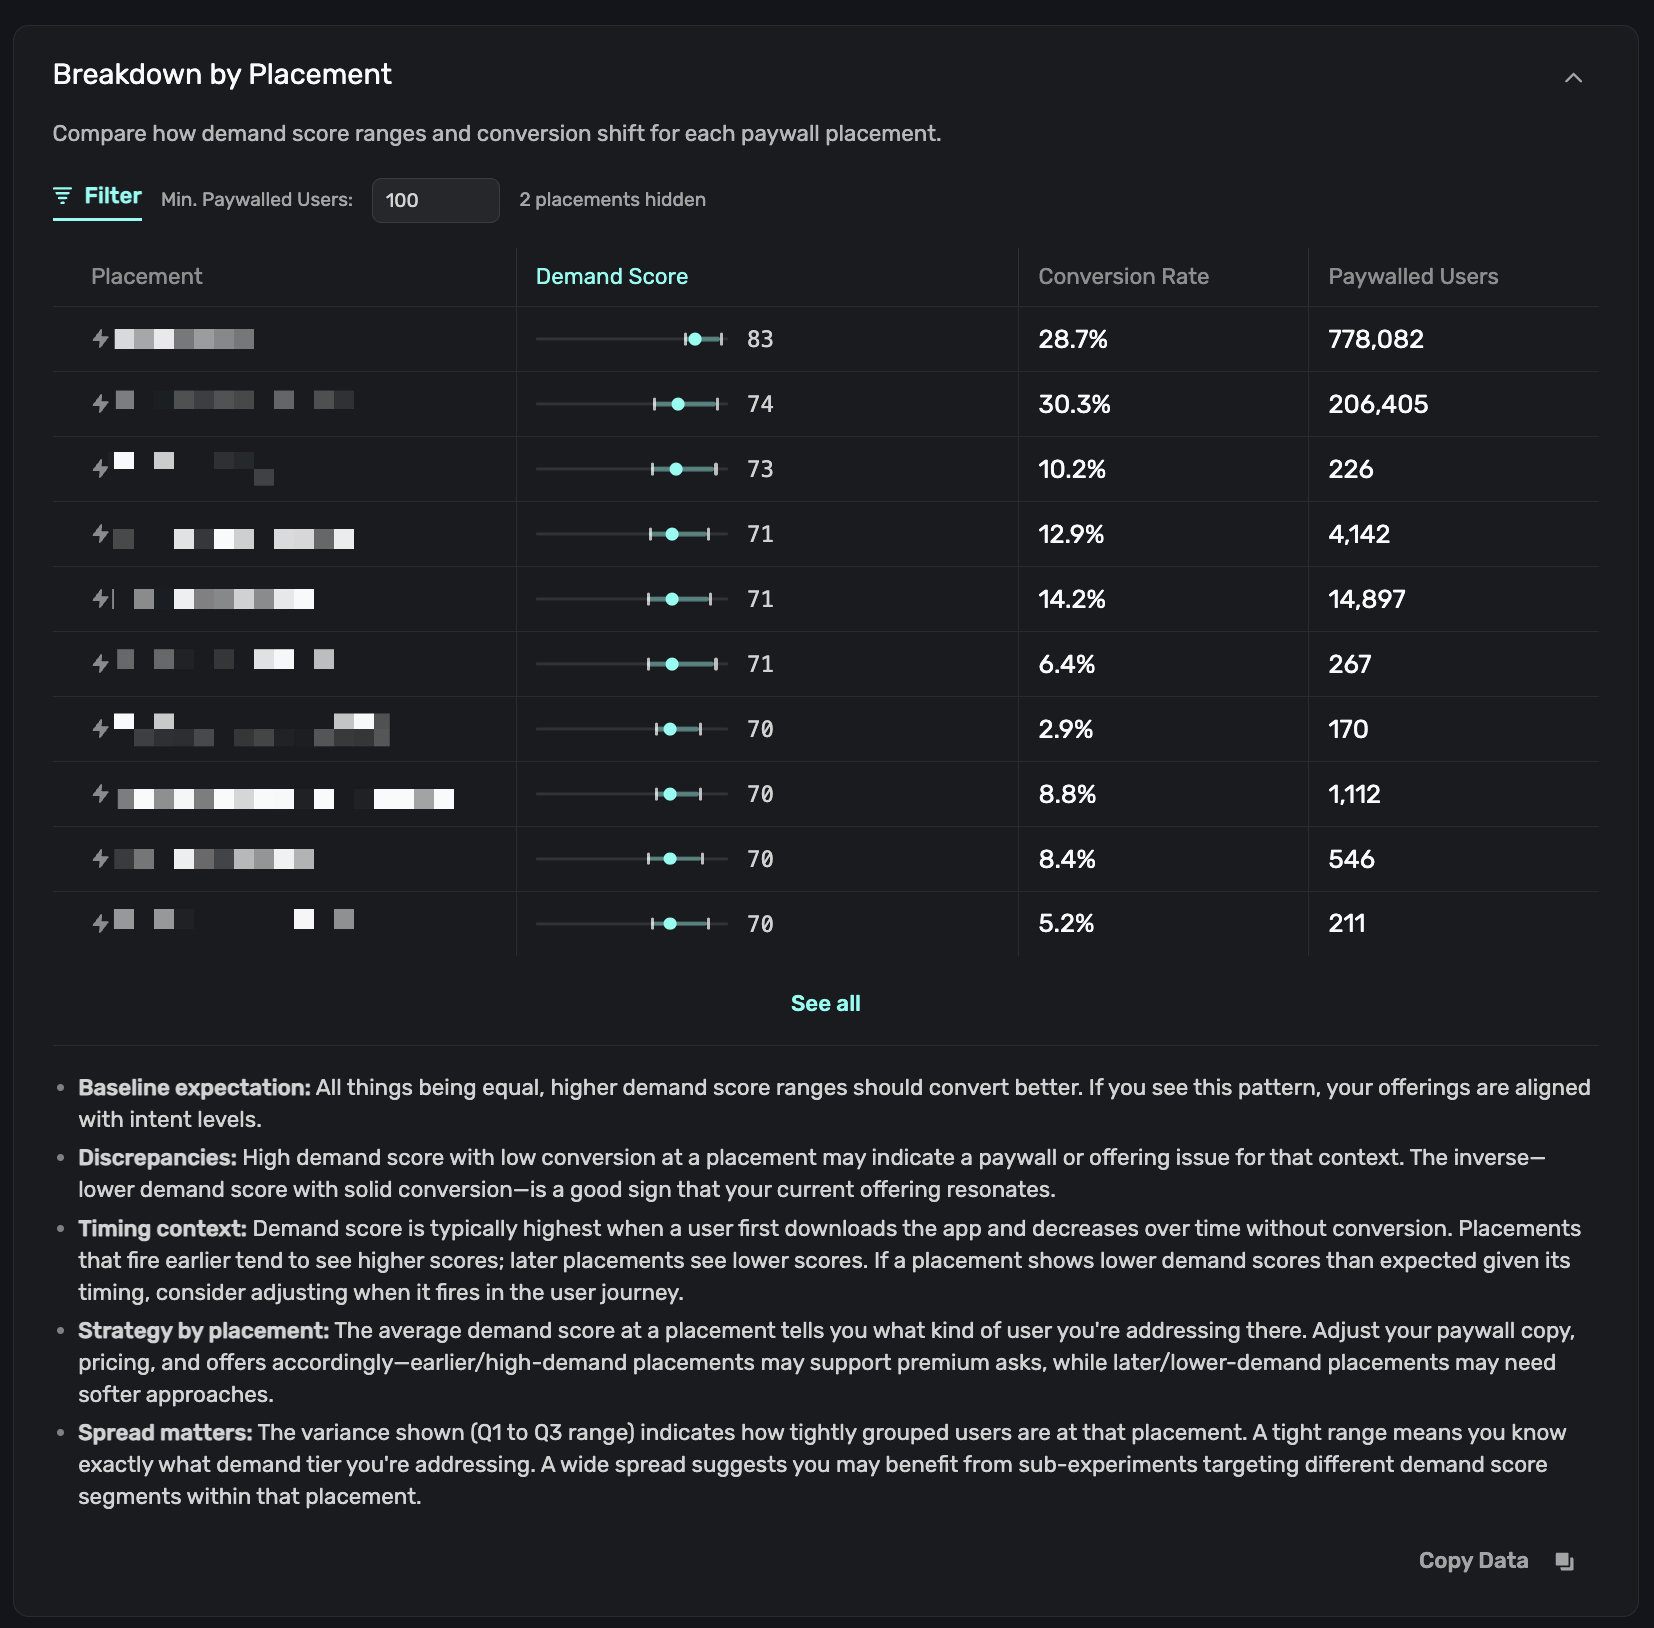
Each row displays:
| Column | Description |
|---|---|
| Placement | The placement name (e.g., GetStarted, transaction_abandon). |
| Demand Score | A range visualization showing the Q1 (lower quartile), median, Q3 (upper quartile), and average demand score for users at that placement. |
| Conversion Rate | The overall conversion rate at that placement. |
| Paywalled Users | Total number of unique users who saw a paywall at that placement. |
Use the Min. Paywalled Users filter to hide low-volume placements and focus on statistically meaningful data.
How to read the demand score range: A tight range (Q1 and Q3 close together) means you're addressing a specific demand tier at that placement. A wide spread suggests the placement sees a mix of intent levels, and you may benefit from sub-experiments targeting different tiers within that placement.
High demand score with low conversion at a placement may indicate a paywall or offer issue. Low demand score with solid conversion is a good sign that your offering resonates even with lower-intent users.
Breakdown by country
The Breakdown by Country table uses the same format as the placement breakdown, but groups data by the user's country:
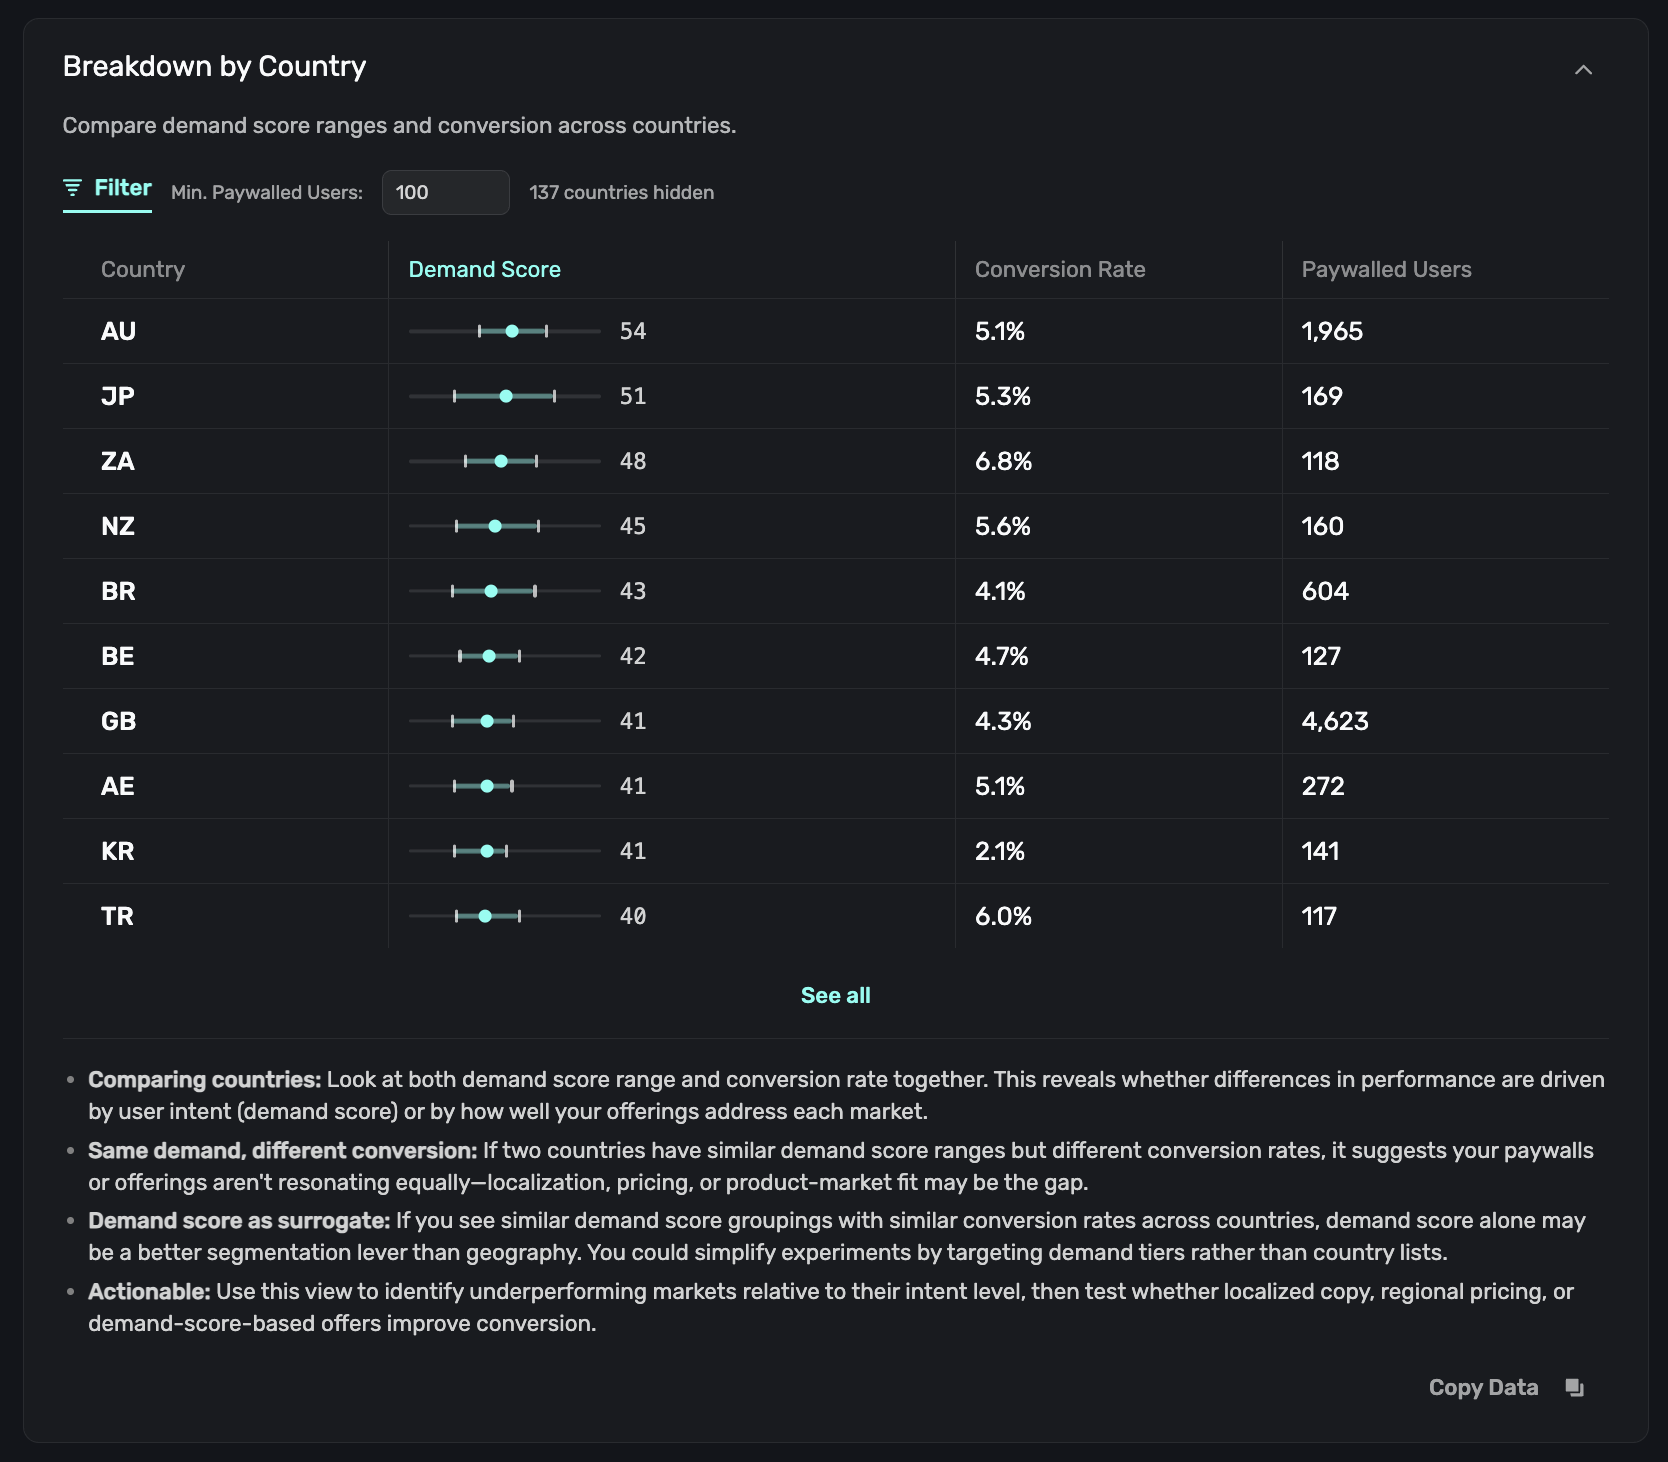
Use this view to:
- Compare intent vs. performance across markets. If two countries have similar demand score ranges but different conversion rates, the gap is likely driven by localization, pricing, or product-market fit rather than user intent.
- Simplify segmentation. If countries with similar demand scores also show similar conversion rates, targeting by demand score alone may be more effective than targeting by geography.
- Find underperforming markets. Countries with reasonable demand ranges but low conversion are candidates for localized pricing or copy experiments.
AI Analysis
The AI Analysis section generates an AI-powered summary of your demand score data for the selected date range. Click Generate AI analysis to create a report:
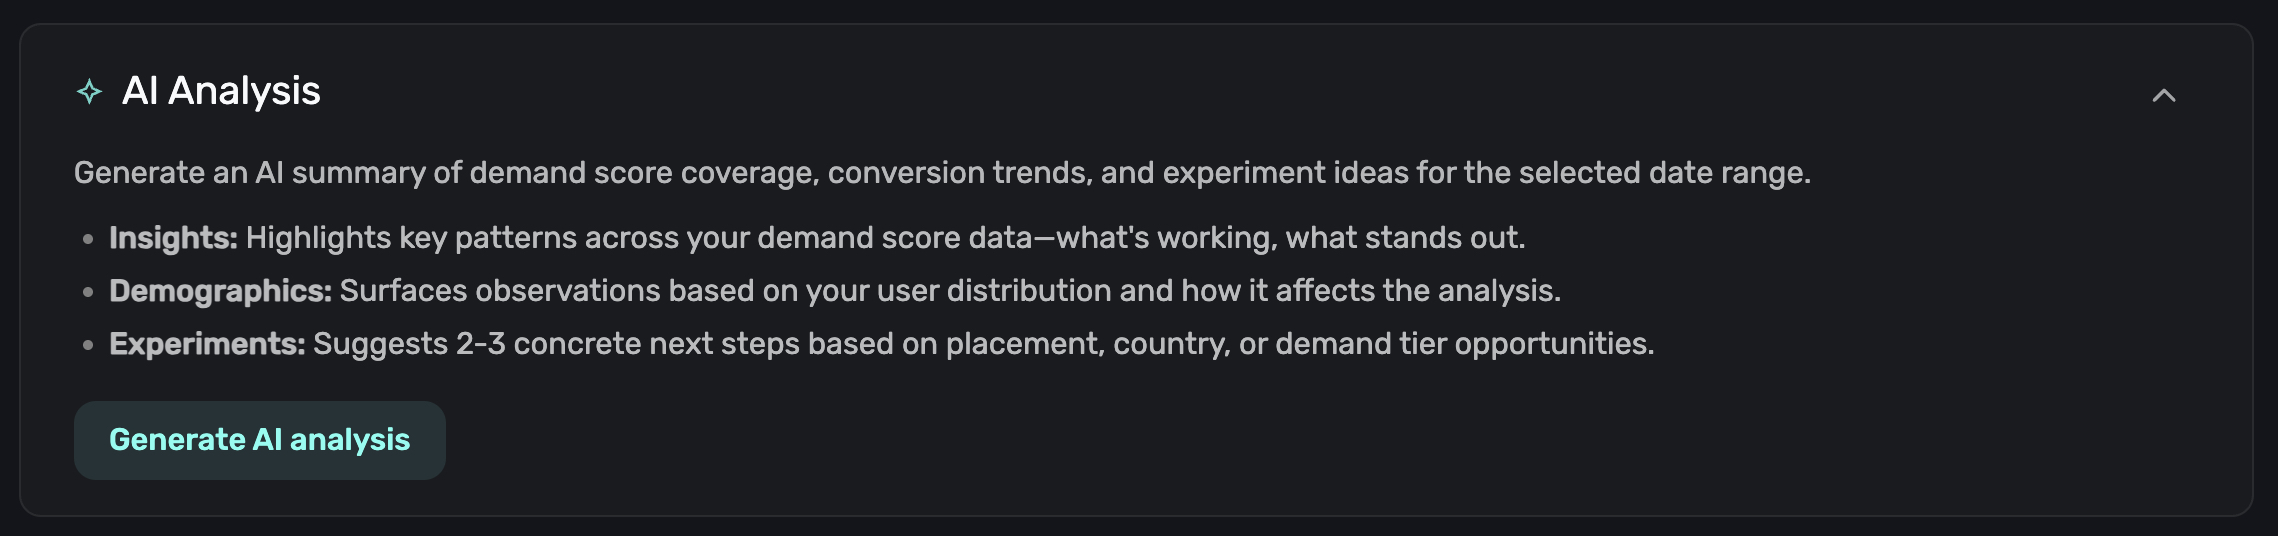
The report includes three sections:
- Insights: Key patterns across your data, including what's working, what stands out, and where the opportunities are.
- Demographics: Observations about your user distribution and how volume concentration affects the analysis.
- Experiments: Two to three concrete next steps based on placement performance, country data, or demand tier opportunities.
The analysis is cached locally. If you change the date range or the cached report is more than a day old, click Regenerate to get a fresh analysis.
The AI analysis is a great starting point for deciding what experiments to run. See Using Demand Score in Campaigns for how to act on these recommendations.
Adjusting bucket size
Each chart section includes a Bucket size slider that controls how demand scores are grouped. The available sizes are 1, 2, 4, 5, 10, 20, and 25:
- Smaller buckets (e.g., 1 or 2) give more granular data but can be noisy with low sample sizes.
- Larger buckets (e.g., 10 or 25) smooth out noise and show clearer trends.
Start with the default bucket size of 10 and adjust based on your user volume.
Exporting data
Each chart section has a Copy Data button that copies the chart's data to your clipboard in CSV format. Use this to perform further analysis in a spreadsheet or share data with your team.
How is this guide?
Using Demand Score
Demand Score is a 1-100 value assigned to each user by Superwall, indicating their likelihood to convert. Use it to understand your audience and target users with the right offers.
Using Demand Score in Campaigns
Learn how to create audiences based on demand score ranges to run targeted experiments and improve conversion.