Benchmarks
See how your app's conversion, monetization and retention compare with similar apps or your store category on the same platform, refreshed every night.
Benchmarks is in the new dashboard at app.superwall.com. The old dashboard doesn't have it.
Benchmarks shows how your app's metrics compare with anonymized peer apps: how often installs convert, how much each customer is worth, how many renew, and more. For each metric you see your own value, the peer median and where you sit among peers. The page also picks out the gap that's worth the most to close.
Open it from Analytics → Benchmarks in the sidebar.
Before you start
- Native iOS and Android apps only. Web, Stripe and web checkout apps don't have Benchmarks.
- $1,000 a month in revenue. Peer comparisons unlock once your app has made $1,000 in net revenue over the last 30 days. Below that, the page shows your own numbers and your progress toward unlocking them.
- One nightly run. Benchmarks are worked out every night. A new app appears after its first run, and the page says so until then.
Anyone who can view Charts in the app can view Benchmarks.
Who you're compared with
Your peers are other apps on Superwall on the same platform as yours: an iOS app is compared only with iOS apps, and an Android app only with Android apps. Within that platform, peers are one app per company and never one of your own. So a company's Android app can be a peer for your Android app even if the company also ships on iOS.
Peers are anonymized: you see what kind of apps are in a group and how many there are, never which apps. Only apps with enough revenue and paying users in the last 30 days count as peers, so a group isn't padded with apps that barely sell.
Choose the peer group with the tabs beside the page title. Each tab compares only with its own group: a metric is never compared with the other tab's group, or with any wider one.
Similar apps
The default. Superwall turns each app's store listing (App Store or Google Play) into an embedding (a numeric description of what the app is and does), then uses a nearest-neighbor (kNN) match to find the iOS apps, or Android apps, closest to yours. Every app that's close enough joins the group, so it grows as more apps qualify. An app that earns much more or much less than yours has to be closer still to count. An Android app that also has an iOS version is matched by its App Store listing, but only against Android apps.
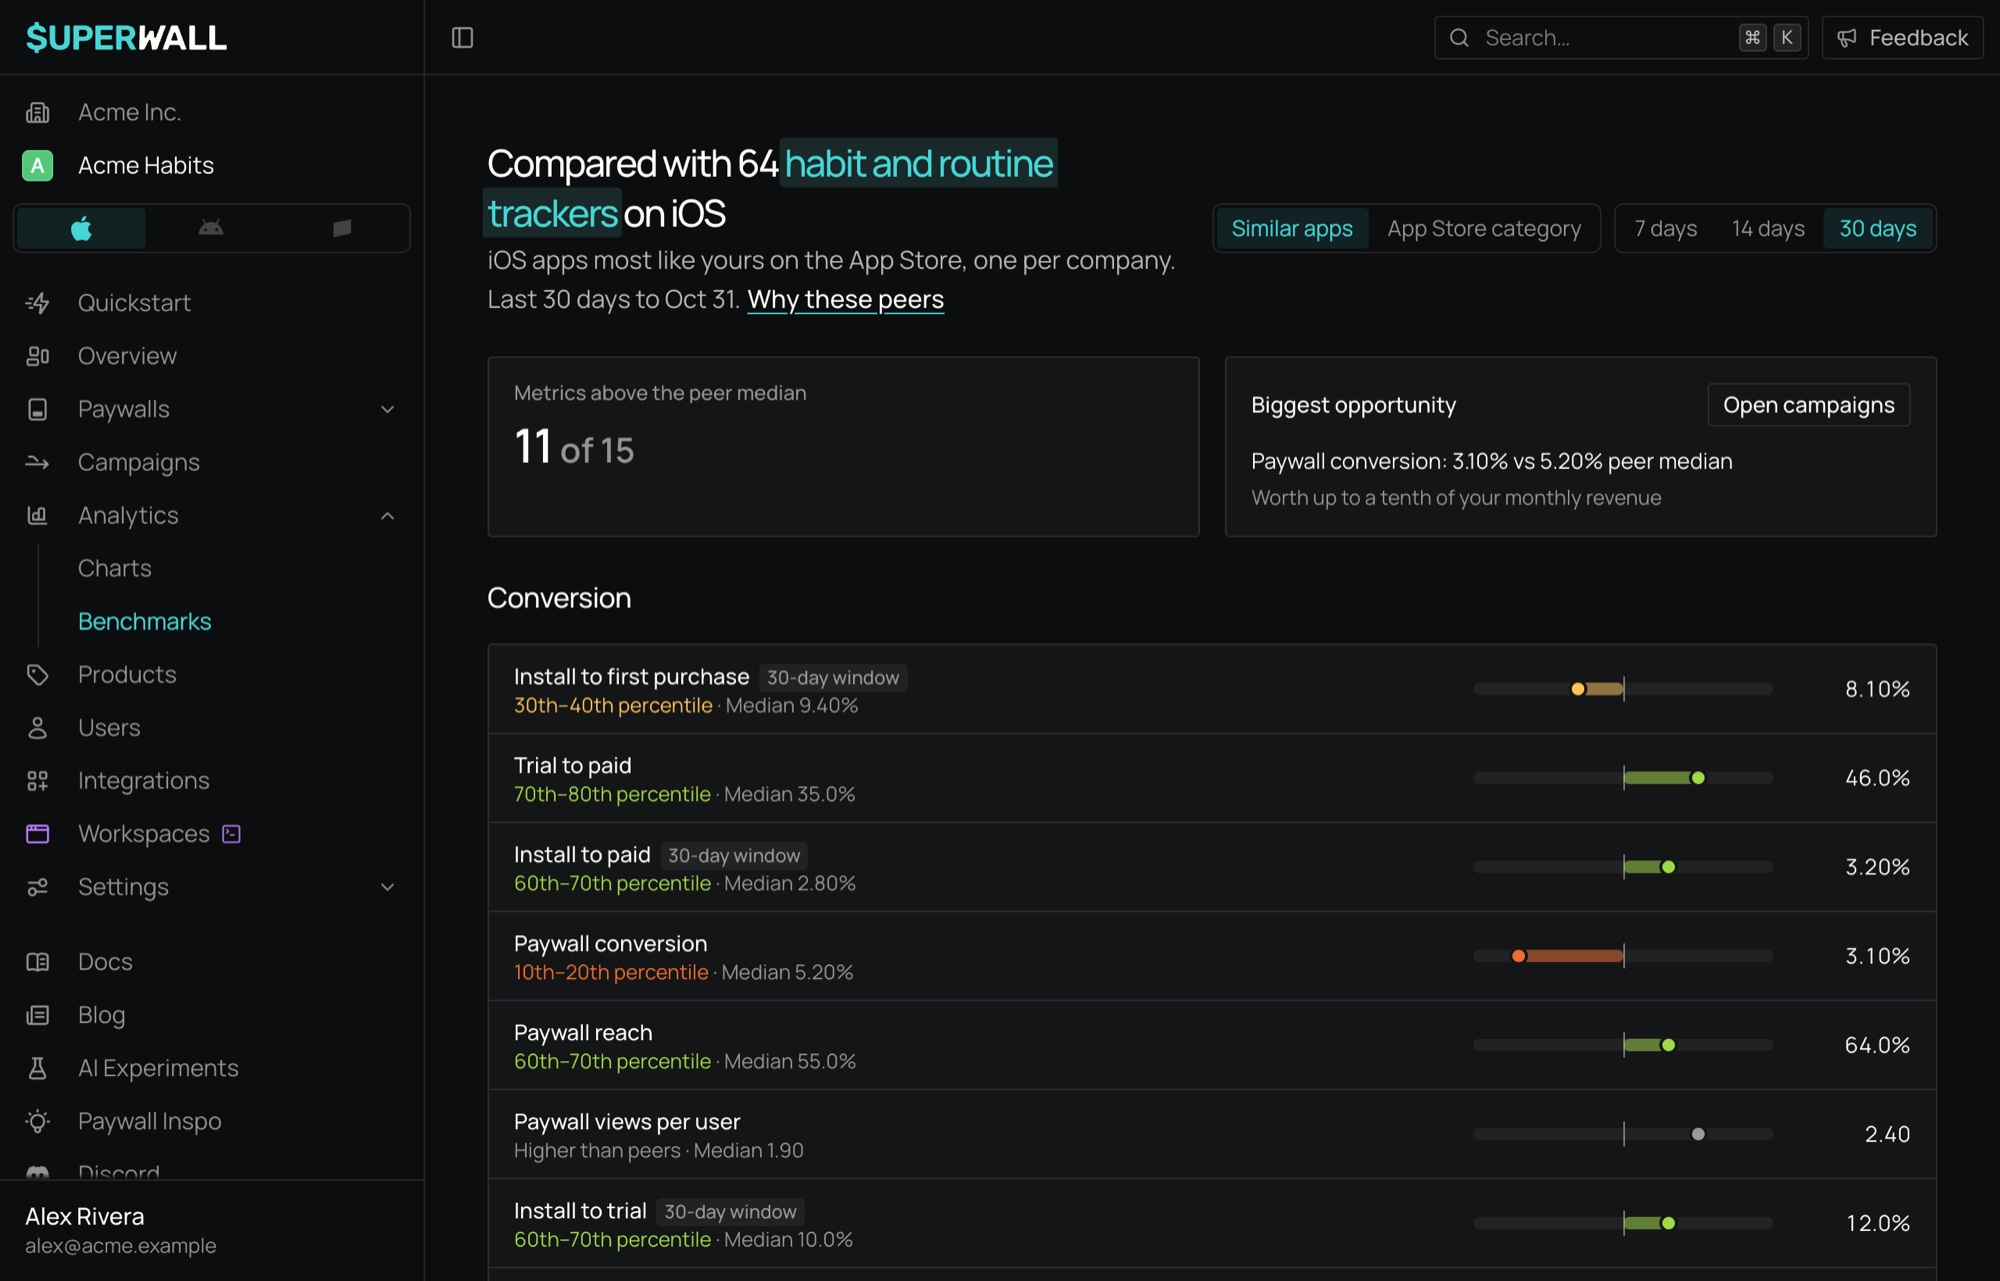
The group is named for what its apps have in common, such as "habit and routine trackers".
App Store category or Google Play category
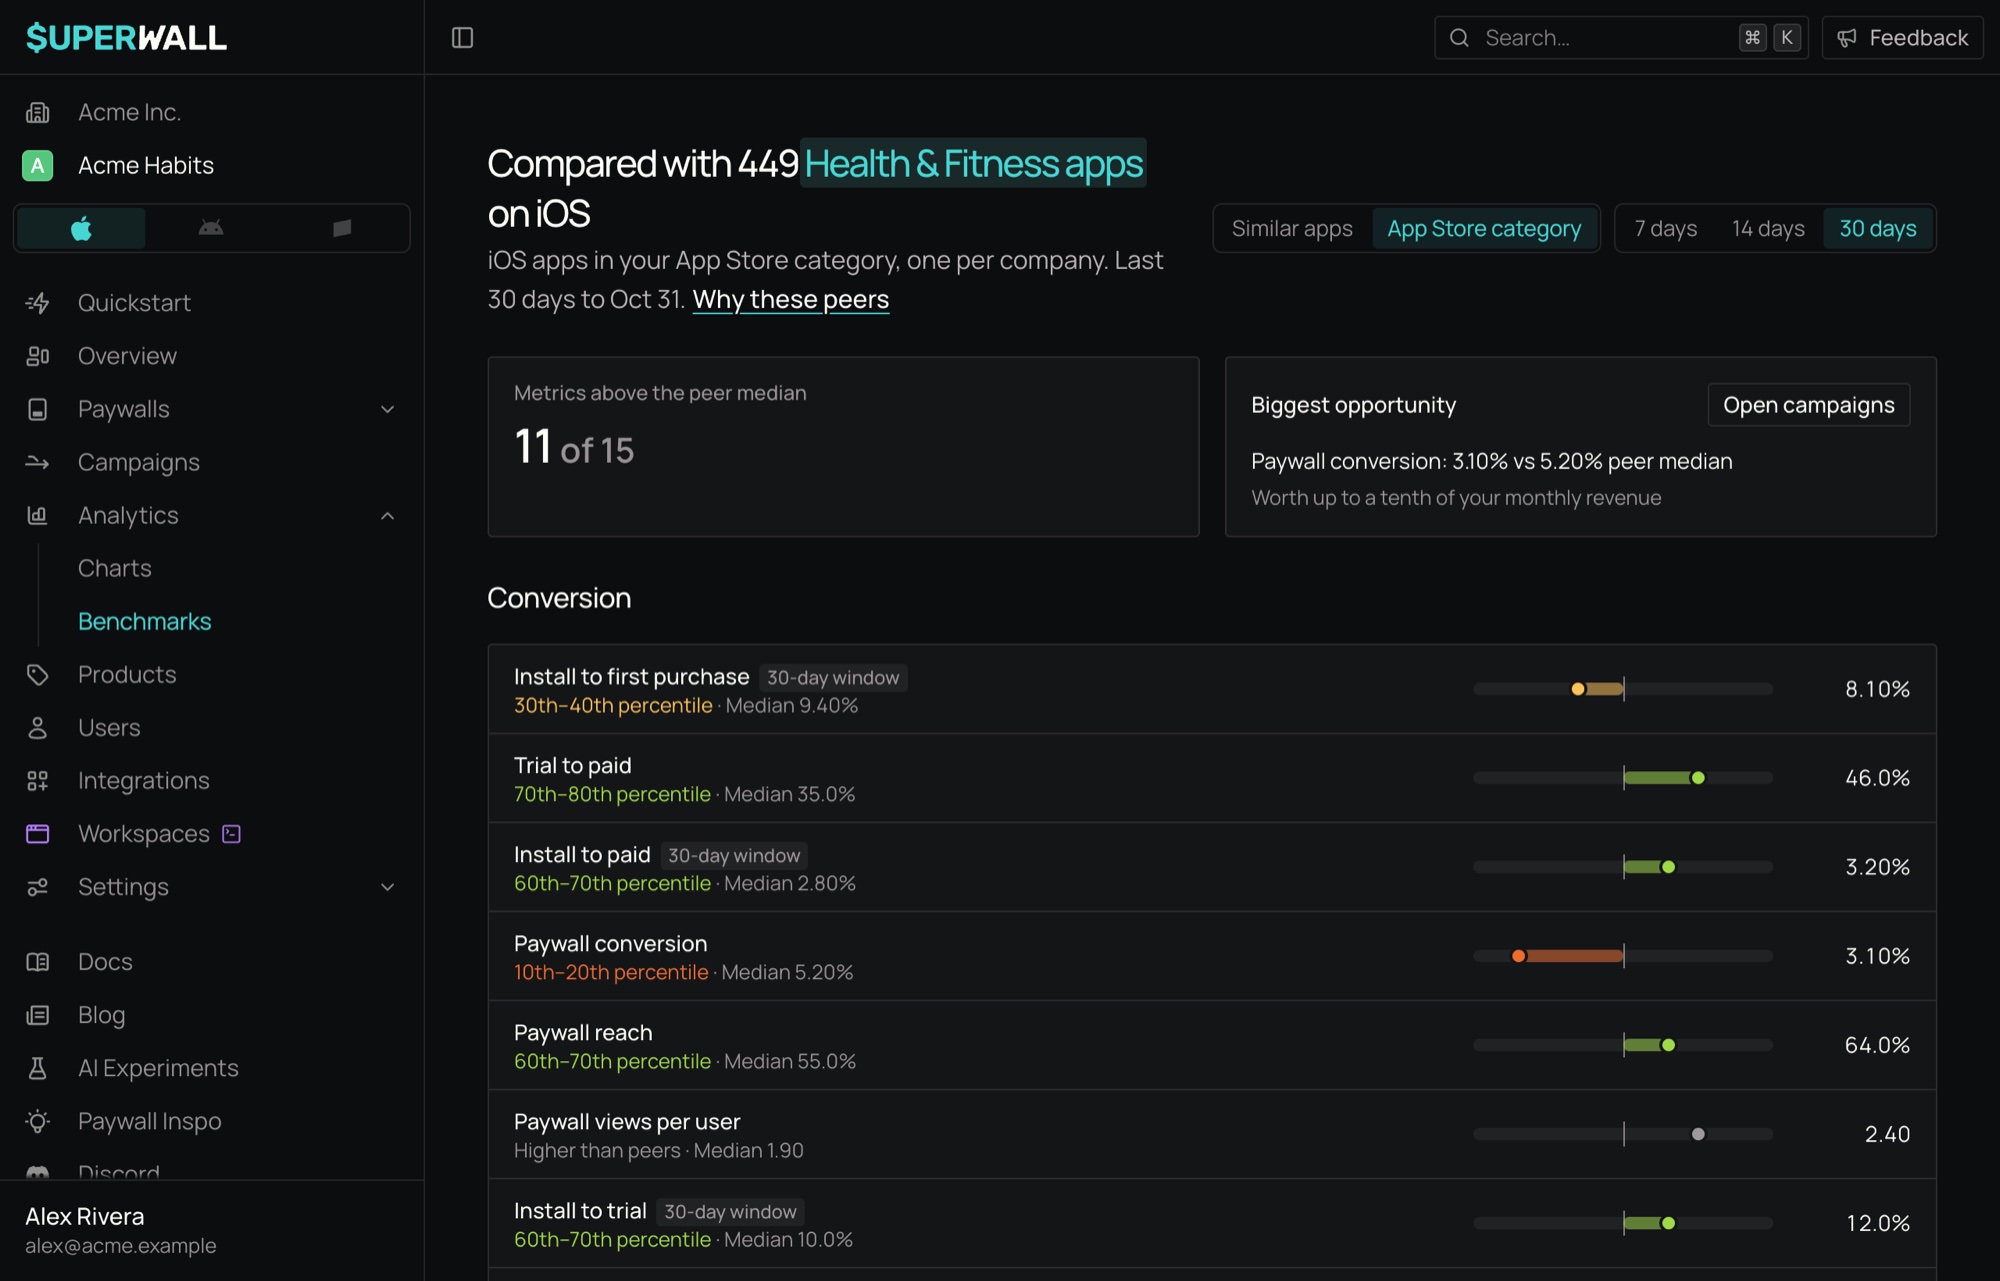
The second tab is App Store category for iOS apps and Google Play category for Android apps. It compares you with every eligible app on your platform in your store category, such as Health & Fitness. Google Play categories are grouped like the App Store's, so Tools counts as Utilities and Dating as Lifestyle.
The page title and "Why these peers"
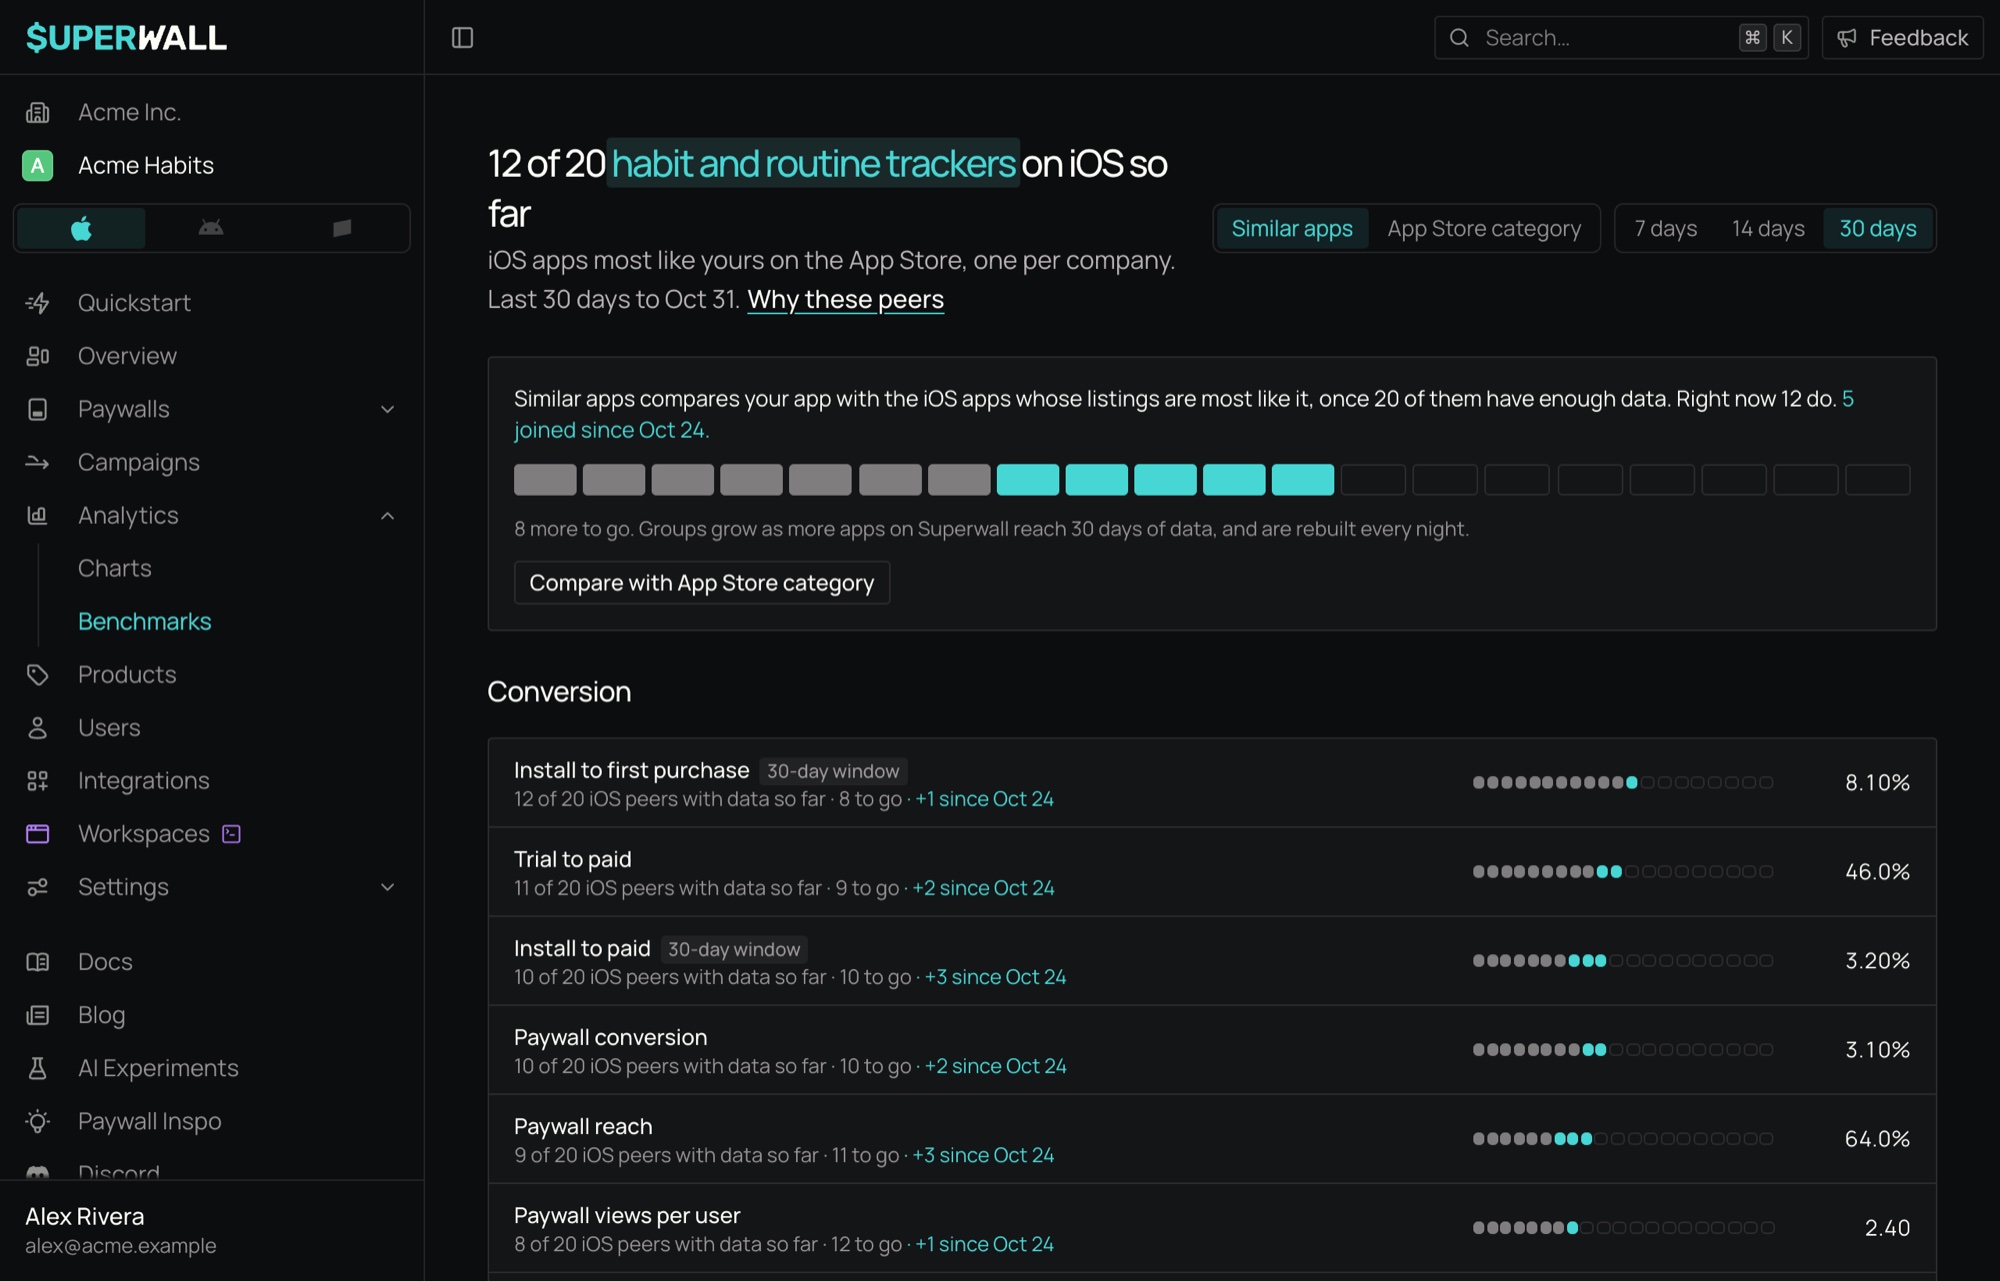
The page title names the group you're compared with, with the group's name marked in teal: Compared with 64 habit and routine trackers on iOS. The number is the size of the whole group. A single metric can be compared with fewer peers, because not every peer has enough data for every metric. When the group has fewer than 20 companies, the title says how far along it is instead, for example 12 of 20 habit and routine trackers on iOS so far (see When a tab is still growing).
Under the title, one line says how the group was formed, such as "iOS apps most like yours on the App Store, one per company." or "Android apps in your Google Play category, one per company." Click Why these peers to see:
- how the group was formed;
- what's in it, by subcategory (the six largest, with the rest counted as "Other");
- that it holds only apps on your platform: "Only iOS apps, one per company, and never one of yours."
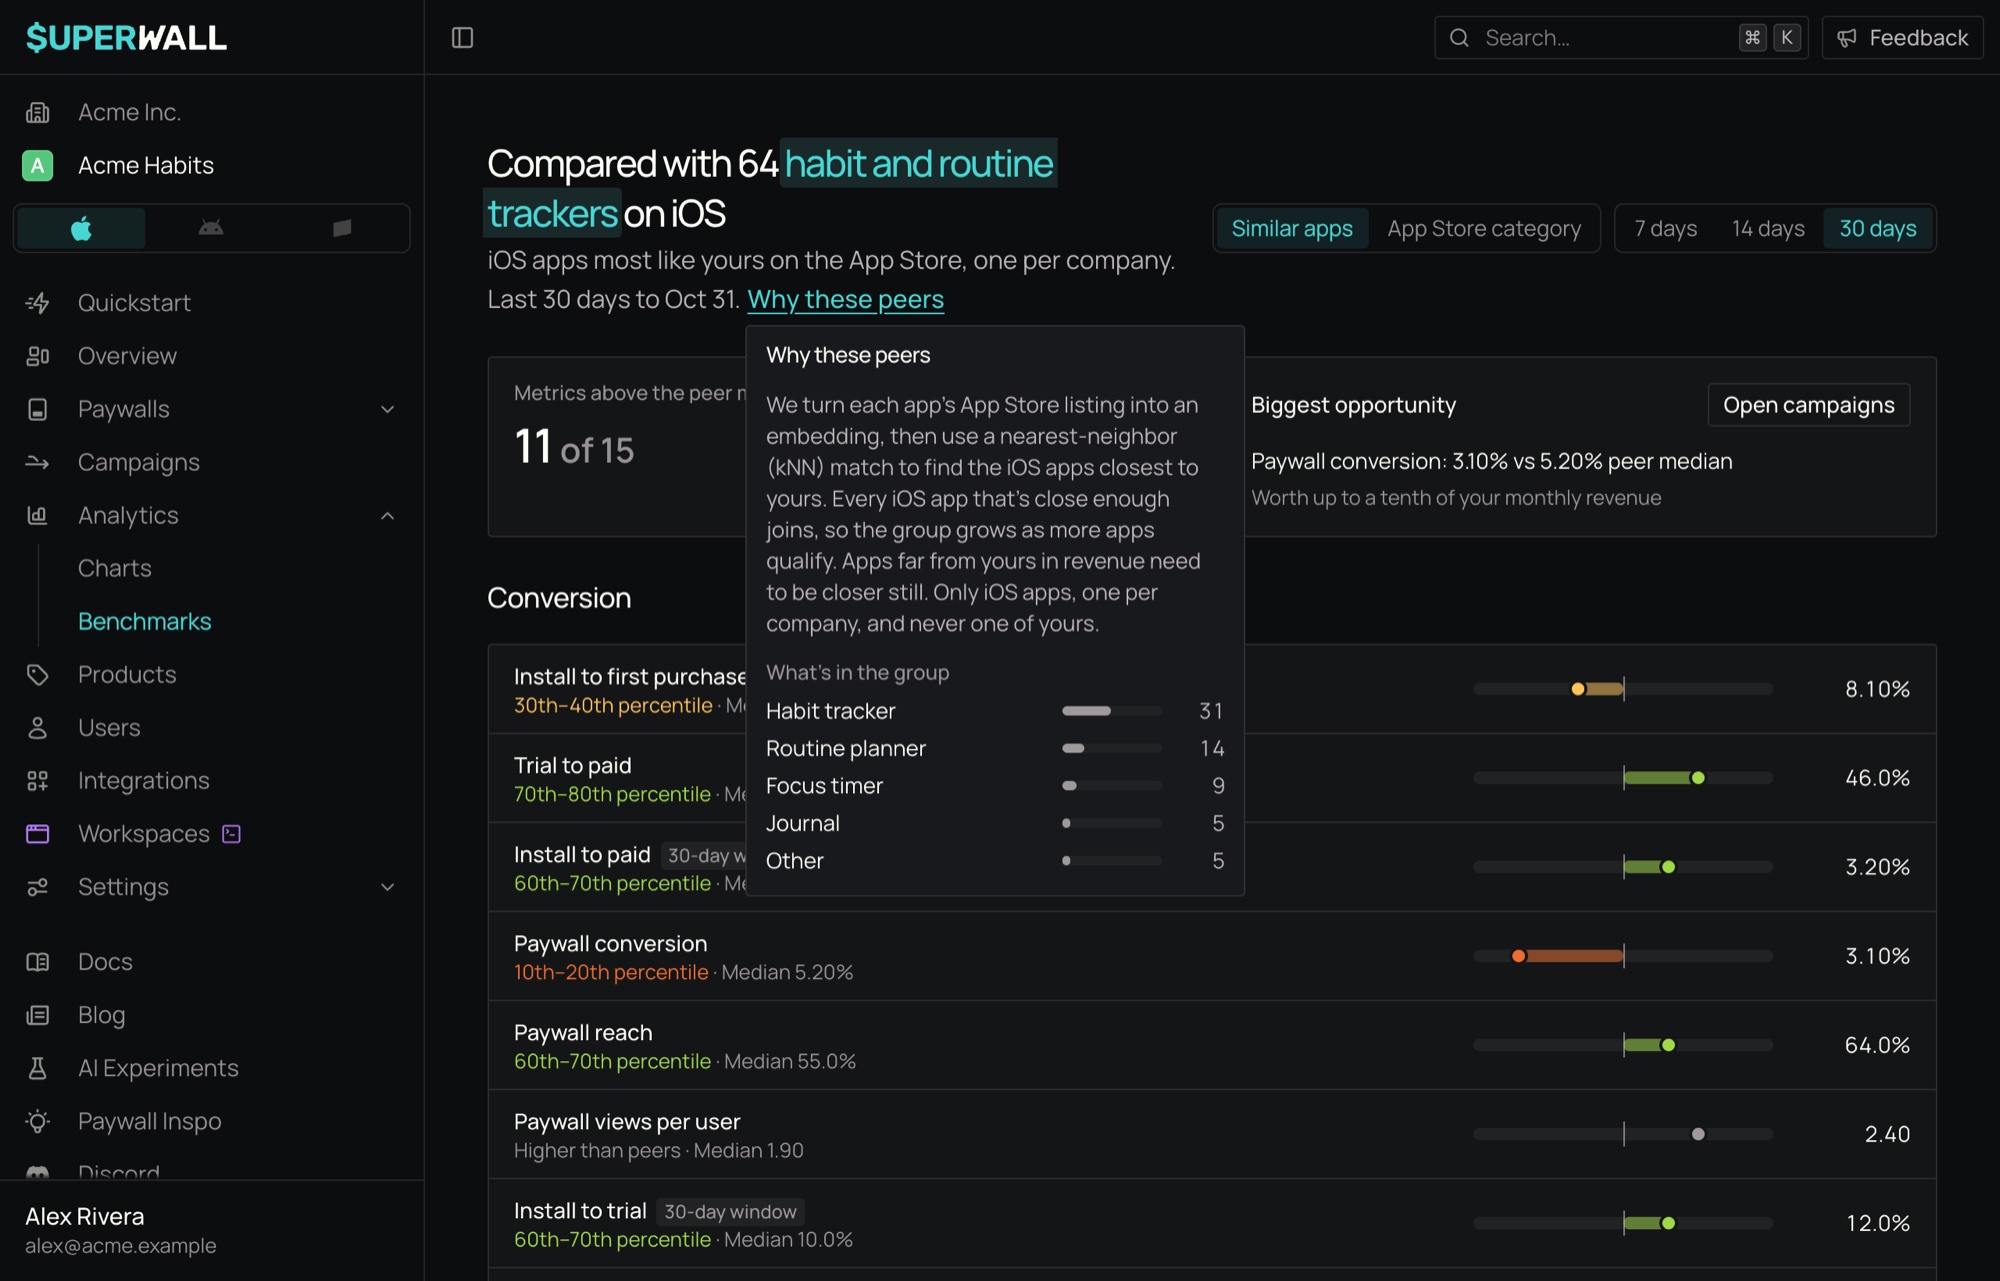
To keep peers anonymous, a subcategory with only one or two apps in it is always counted as "Other".
Choose a window
Use 7 days, 14 days or 30 days to choose how long installs have to convert. It applies to the metrics marked with a window badge, such as Install to first purchase · 30-day window: these count what installs did within that many days of installing. Every other metric always covers the last 30 days.
Read a metric row
Metrics are grouped into Conversion, Monetization, Retention, Pricing and mix and Practice.
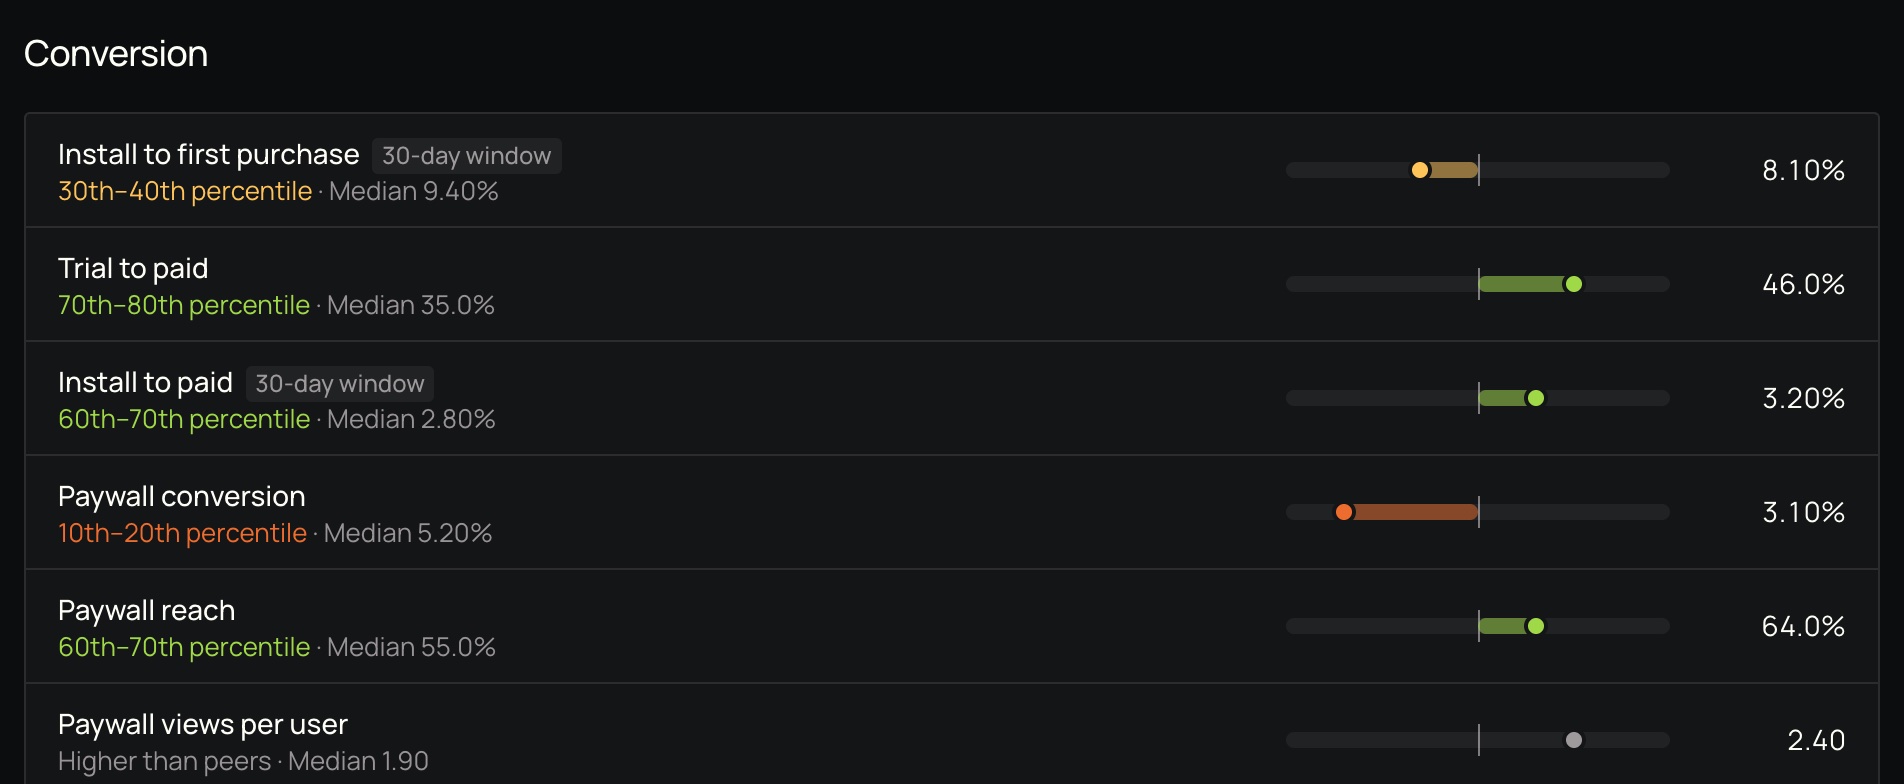
Each row shows:
| Part | What it means |
|---|---|
| Value | Your app's value, on the right. |
| Percentile band | Where you sit among peers, in tenths: 70th–80th percentile means you're ahead of at least 70% of peers. Green is at or above the median, yellow is between the 20th percentile and the median, and orange is the bottom 20%. |
| Median | The peer median for the metric. |
| Track | Left is the bottom 10% of peers, right is the top 10%. The tick in the middle is the peer median, and the bar runs from it to you. |
Further right is always better, even for metrics where a lower number is better, such as Monthly churn or Refund rate: a low churn rate places you in a high percentile.
A percentile band changes only after two nightly runs agree, so a single unusual day doesn't move it.
Context metrics
Prices, trial length, plan mix and a few others aren't better or worse when higher. Rows in Pricing and mix and the other context metrics say Higher than peers, Lower than peers or About the same as peers, and show the peer median, but aren't scored. They're there so you can see how your offer compares.
Metric details
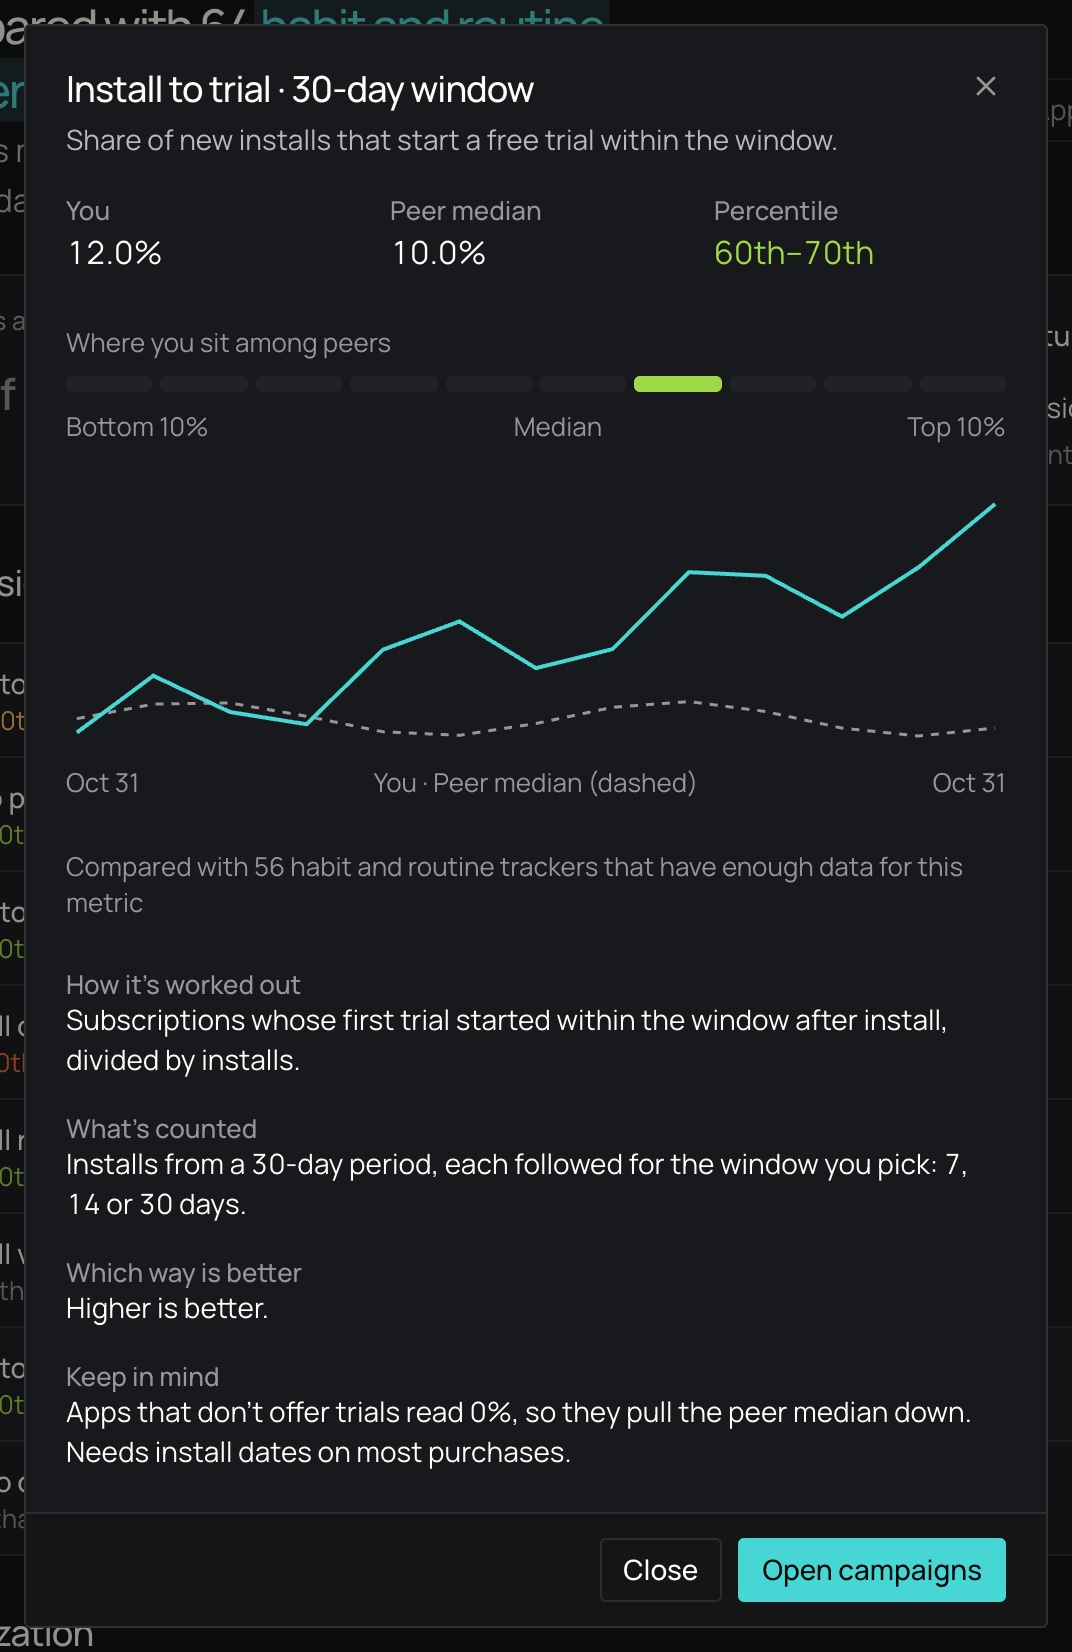
Click a row to open its details: your value, the peer median and your percentile, a strip of the ten bands with yours lit, how the metric has moved over the last 13 months, and How it's worked out, the metric's definition (also listed under Metrics below). Where it applies, a button takes you to the part of the dashboard that changes the metric, such as your campaigns.
When a metric has no comparison
| Row says | Why |
|---|---|
| Not enough data yet · needs 50 matured trials, has 32 | Your app doesn't have enough of what the metric is measured over yet. |
| Not enough data yet · install dates are missing on most purchases | The metric needs the install date of each purchase, and most of yours don't have one. |
| Not enough data yet · the SDK and store data disagree | Superwall's SDK events and your store's data don't match closely enough to trust the value. |
| 14 of 20 iOS peers with data so far · 6 to go | Fewer than 20 peers in this tab's group have this metric's data yet. See below. |
When a metric has too few peers
A comparison needs at least 20 peer companies with the metric's data. When fewer have it, the metric keeps its row and your own value, and the row shows how close it is: a 20-slot track in place of the percentile track, and a line such as 14 of 20 iOS peers with data so far · 6 to go. If the group has gained peers with the data since an earlier run, the row adds +3 since Oct 27 in teal.
Nothing on the page is loading: a group grows over nights, not seconds.
Counts under 5
To keep small groups anonymous, the page never shows an exact count under 5. A metric that fewer than 5 peers have data for reads Fewer than 5 of 20 iOS peers with data so far, and a group with fewer than 5 companies is titled Fewer than 5 habit and routine trackers on iOS so far. Neither shows how much it grew lately, and a group that small doesn't show its make-up.
When a tab is still growing
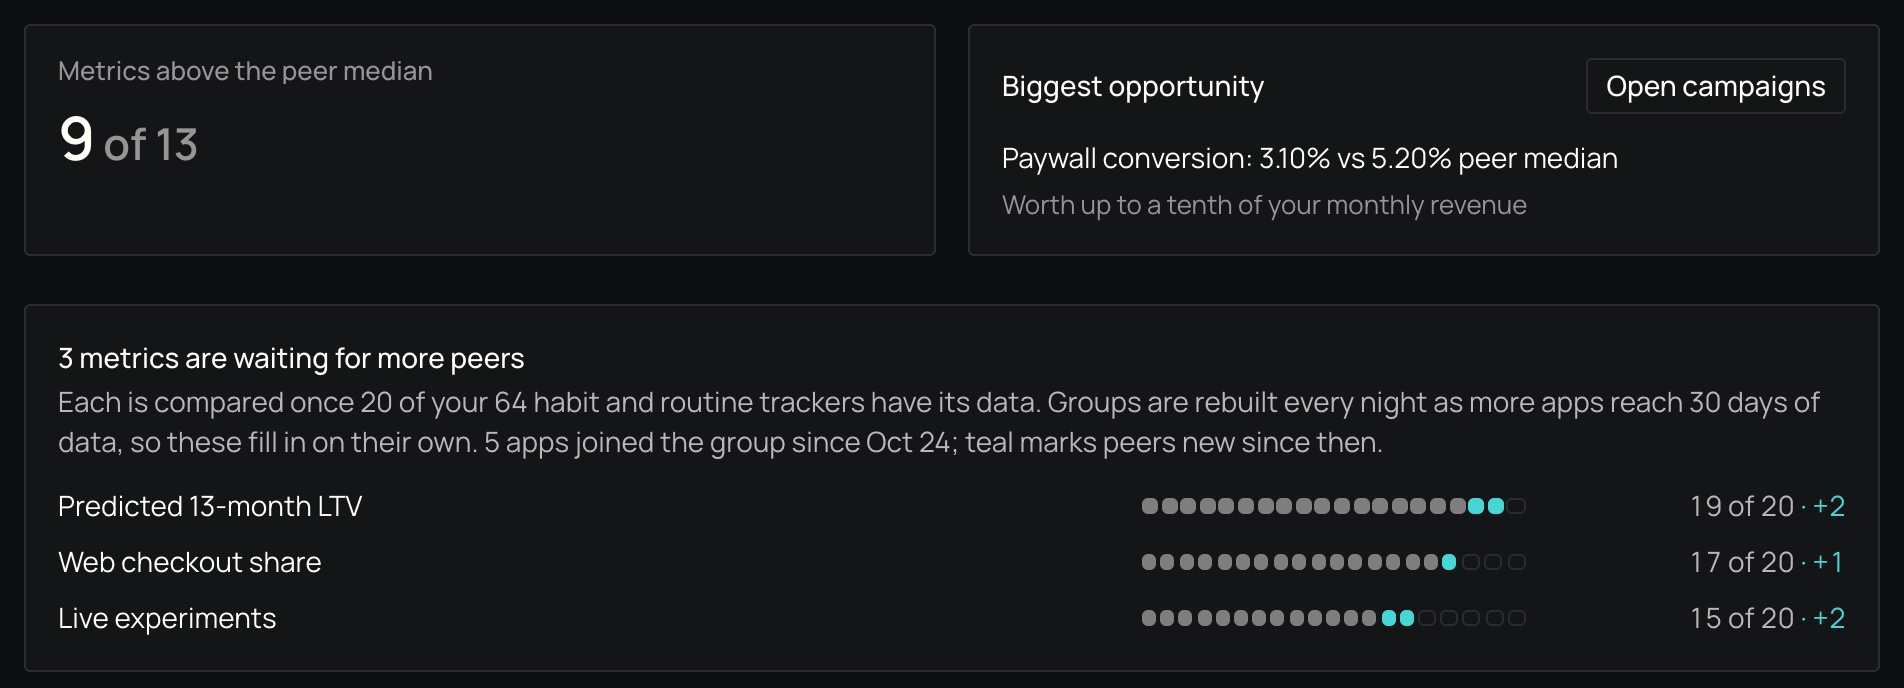
When some metrics are waiting for more peers, a notice under the score cards lists them, closest to 20 first, each with its slot track and count. It says how many peers in your group each needs, and how much the group has grown lately: "Groups are rebuilt every night as more apps reach 30 days of data, so these fill in on their own." When there's an earlier run to compare with, it adds how many apps joined the group since then, and teal marks the peers that are new since that date.
- Section note. When most of a section's metrics are waiting, the section says so once under its heading, for example "5 of 8 conversion metrics are waiting for more peers with data."
- Switch tabs. When most of a tab's metrics are waiting, or its group is under 20, the page offers Compare with App Store category (or Compare with Google Play category) on the Similar apps tab, and Compare with similar apps on the category tab.
- A group under 20. When the tab's group itself has fewer than 20 companies, nothing on the tab can be compared yet. The title says how far along it is, such as 12 of 20 habit and routine trackers on iOS so far, or 7 of 20 similar apps on Android so far when the group has no name yet, and the notice takes the place of the score cards: a 20-slot track with new peers in teal, how many joined lately and how many more it needs. Your own numbers still show below.
Groups are rebuilt every night (see How often data refreshes), so these states clear on their own as your group grows.
Metrics above the median and the biggest opportunity
Two cards sit at the top of the page (when the tab's group has fewer than 20 companies, the growing notice takes their place):
- Metrics above the peer median counts the scored metrics where you're at or above the median, out of all scored metrics with a comparison. Context metrics aren't counted.
- Biggest opportunity is the scored metric below the median that would add the most revenue if you reached the peer median. The estimate is conservative: half of the straight-line gain, and never more than a tenth of your monthly revenue. A button opens the part of the dashboard where you'd work on it. When there's no such metric, the card says why: Nothing scored yet when no scored metric has a comparison, or No clear gap to close when every scored metric is at or above the median, or none you can act on directly is below it.

Metrics
These are the same definitions the dashboard shows: click a metric's row, and its details end with How it's worked out.
Conversion
Install to first purchase: Share of new installs that make a first purchase or start a trial within the window.
- How it’s worked out: Installs that completed a purchase or started a trial within the window after install, divided by installs.
- What’s counted: Installs from a 30-day period, each followed for the window you pick: 7, 14 or 30 days.
- Which way is better: Higher is better.
- Keep in mind: Counted from the Superwall SDK’s install and purchase events on the device.
Trial to paid: Share of free trials that turn into a paid subscription.
- How it’s worked out: Trials that went on to a paid period, divided by trials started.
- What’s counted: Trials that started 30 to 60 days ago, so each has had time to convert.
- Which way is better: Higher is better.
- Keep in mind: Only apps that offer free trials have a value.
Install to paid: Share of new installs that start paying within the window.
- How it’s worked out: Subscriptions whose first paid charge came within the window after install, divided by installs.
- What’s counted: Installs from a 30-day period, each followed for the window you pick: 7, 14 or 30 days.
- Which way is better: Higher is better.
- Keep in mind: Needs install dates on most purchases. Without them, the app shows no value rather than a misleadingly low one.
Paywall conversion: Share of users who saw a paywall and then made a purchase.
- How it’s worked out: Users who completed a purchase, divided by users who saw a paywall.
- What’s counted: The last 30 days, whichever window you pick.
- Which way is better: Higher is better.
Paywall reach: Share of active users who saw at least one paywall.
- How it’s worked out: Users who saw a paywall, divided by users who opened the app.
- What’s counted: The last 30 days, whichever window you pick.
- Which way is better: Higher is better.
Paywall views per user: How often active users see a paywall.
- How it’s worked out: Paywall views, divided by users who opened the app.
- What’s counted: The last 30 days, whichever window you pick.
- Which way is better: Neither better nor worse: shown for context and not scored.
Install to trial: Share of new installs that start a free trial within the window.
- How it’s worked out: Subscriptions whose first trial started within the window after install, divided by installs.
- What’s counted: Installs from a 30-day period, each followed for the window you pick: 7, 14 or 30 days.
- Which way is better: Higher is better.
- Keep in mind: Apps that don’t offer trials read 0%, so they pull the peer median down. Needs install dates on most purchases.
Time to convert: Typical time from install to a first trial or purchase.
- How it’s worked out: The median time from install to the start of the first trial or paid period.
- What’s counted: Subscriptions started in the last 30 days.
- Which way is better: Neither better nor worse: shown for context and not scored.
- Keep in mind: Only subscriptions with an install date count.
Monetization
Monthly LTV per customer: Net proceeds per active user over a month.
- How it’s worked out: Net proceeds after store fees and refunds, divided by users who opened the app.
- What’s counted: The last 30 days, whichever window you pick.
- Which way is better: Higher is better.
- Keep in mind: It moves with conversion, pricing and retention together, so it’s scored but never shown as the biggest opportunity.
Monthly LTV per paying customer: Net proceeds per paying subscription over a month.
- How it’s worked out: Net proceeds after store fees and refunds, divided by subscriptions that paid in the last 30 days.
- What’s counted: The last 30 days, whichever window you pick.
- Which way is better: Higher is better.
- Keep in mind: It moves with conversion, pricing and retention together, so it’s scored but never shown as the biggest opportunity.
Revenue per paywall view: Net proceeds earned per paywall view.
- How it’s worked out: Net proceeds after store fees from purchases made on a paywall, divided by paywall views.
- What’s counted: The last 30 days, whichever window you pick.
- Which way is better: Higher is better.
- Keep in mind: It moves with conversion, pricing and retention together, so it’s scored but never shown as the biggest opportunity.
Revenue per install: Net proceeds each new install brings in within the window.
- How it’s worked out: Net proceeds after store fees and refunds from purchases made within the window after install, divided by installs.
- What’s counted: Installs from a 30-day period, each followed for the window you pick: 7, 14 or 30 days.
- Which way is better: Higher is better.
- Keep in mind: Needs install dates on most purchases. It moves with conversion, pricing and retention together, so it’s scored but never shown as the biggest opportunity.
Predicted 13-month LTV: Net proceeds booked and still expected over a subscription’s first 13 months.
- How it’s worked out: The average per new subscription, churned ones included, of net proceeds booked in its first 13 months plus those Superwall still predicts, after store fees and refunds. Free grants and one-time unlocks that never paid don’t count.
- What’s counted: Subscriptions started in the last 30 days.
- Which way is better: Higher is better.
- Keep in mind: It moves with conversion, pricing and retention together, so it’s scored but never shown as the biggest opportunity.
Retention
Monthly churn: Share of paying subscriptions that ended without renewing over a month.
- How it’s worked out: Paid subscriptions active 30 days ago whose period then ended without a renewal, divided by paid subscriptions active 30 days ago.
- What’s counted: Subscriptions that were paying 30 days ago, followed through the last 30 days.
- Which way is better: Lower is better.
- Keep in mind: Only paid periods count; a trial that ends isn’t churn.
Refund rate: Share of revenue that was refunded.
- How it’s worked out: The refunded amount, divided by gross purchase revenue, both before store fees.
- What’s counted: The last 30 days, whichever window you pick.
- Which way is better: Lower is better.
First renewal rate: Share of new subscribers who renew after their first paid period.
- How it’s worked out: First paid periods followed by a renewal, divided by first paid periods that could renew.
- What’s counted: First paid periods that ended in the last 30 days.
- Which way is better: Higher is better.
Billing issue recovery: Share of billing issues that end in a successful renewal.
- How it’s worked out: Subscriptions with a billing issue that paid again within 30 days, divided by subscriptions with a billing issue.
- What’s counted: Billing issues from 30 to 60 days ago, each followed for 30 days.
- Which way is better: Higher is better.
Pricing and mix
Trial length: Typical length of a free trial.
- How it’s worked out: The median length of the trials started.
- What’s counted: Trials started in the last 30 days.
- Which way is better: Neither better nor worse: shown for context and not scored.
- Keep in mind: Only apps that offer free trials have a value.
Weekly price: Typical price of a new weekly subscription, in US dollars.
- How it’s worked out: The median price paid for new weekly subscriptions, including trials that converted, before store fees.
- What’s counted: New subscriptions in the last 30 days.
- Which way is better: Neither better nor worse: shown for context and not scored.
- Keep in mind: A plan’s length is read from its billing period, so only apps that sell weekly plans have a value.
Monthly price: Typical price of a new monthly subscription, in US dollars.
- How it’s worked out: The median price paid for new monthly subscriptions, including trials that converted, before store fees.
- What’s counted: New subscriptions in the last 30 days.
- Which way is better: Neither better nor worse: shown for context and not scored.
- Keep in mind: A plan’s length is read from its billing period, so only apps that sell monthly plans have a value.
Annual price: Typical price of a new annual subscription, in US dollars.
- How it’s worked out: The median price paid for new annual subscriptions, including trials that converted, before store fees.
- What’s counted: New subscriptions in the last 30 days.
- Which way is better: Neither better nor worse: shown for context and not scored.
- Keep in mind: A plan’s length is read from its billing period, so only apps that sell annual plans have a value.
Annual plan share: Share of new subscriptions that are annual plans.
- How it’s worked out: New annual subscriptions, divided by new weekly, monthly and annual subscriptions.
- What’s counted: Subscriptions started in the last 30 days.
- Which way is better: Neither better nor worse: shown for context and not scored.
- Keep in mind: Other plan lengths, such as quarterly or lifetime, aren’t counted.
Intro offer revenue share: Share of revenue that comes from introductory offers.
- How it’s worked out: Net proceeds from introductory-offer periods, divided by net proceeds from all purchases.
- What’s counted: The last 30 days, whichever window you pick.
- Which way is better: Neither better nor worse: shown for context and not scored.
US revenue share: Share of revenue from customers in the US.
- How it’s worked out: Net proceeds from purchases in the US, divided by net proceeds from all purchases.
- What’s counted: The last 30 days, whichever window you pick.
- Which way is better: Neither better nor worse: shown for context and not scored.
Web checkout share: Share of revenue from web checkout.
- How it’s worked out: Net proceeds from web checkout (Stripe) purchases, divided by net proceeds from all purchases.
- What’s counted: The last 30 days, whichever window you pick.
- Which way is better: Neither better nor worse: shown for context and not scored.
Practice
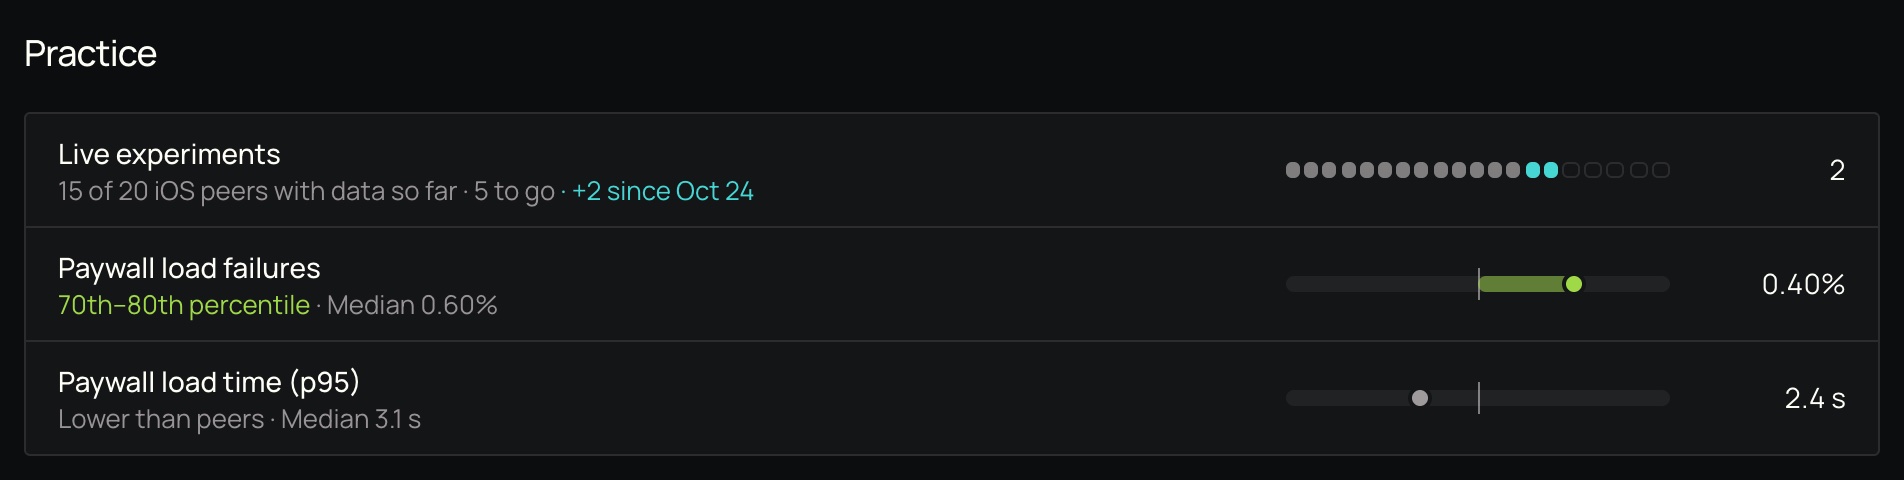
Live experiments: How many paywall experiments the app is running.
- How it’s worked out: Paywall experiments that showed users two or more variants.
- What’s counted: The last 30 days, whichever window you pick.
- Which way is better: Higher is better.
- Keep in mind: Compared only for apps with enough paywall traffic to run experiments.
Paywall load failures: Share of paywall loads that failed.
- How it’s worked out: Paywall loads that failed or timed out, divided by paywall loads started.
- What’s counted: The last 30 days, whichever window you pick.
- Which way is better: Lower is better.
- Keep in mind: Loads include paywalls preloaded in the background, not only the ones a user opened.
Paywall load time (p95): How long the slowest paywall loads take.
- How it’s worked out: The 95th-percentile load time: 95% of loads finish faster than this.
- What’s counted: The last 30 days, whichever window you pick.
- Which way is better: Neither better nor worse: shown for context and not scored.
- Keep in mind: Includes paywalls preloaded in the background, so it’s longer than the wait a user sees.
How often data refreshes
Benchmarks are worked out once a night from the previous 30 days, and the page shows the date the latest run covers ("Last 30 days to Nov 1"). Peer groups are rebuilt every night too, so a group can grow or shrink as apps start or stop qualifying.
Read benchmarks through the API
You can also read these numbers through the API: the Benchmarks endpoints are in the Charts V2 section of the API reference.
Related
How is this guide?
Using Demand Score in Campaigns
Learn how to create audiences based on demand score ranges to run targeted experiments and improve conversion.
Assets
Upload images and videos once to the Superwall Assets library, then reuse them in any paywall. Covers uploading, discovering existing media and deleting.