Organization Overview and Charts
See proceeds, users, and conversions for every project in your organization, chart them together or by project, and open any project from one list.
The organization pages show your whole organization at once instead of one app at a time. They're for anyone who runs more than one app and wants totals across all of them, or wants to compare projects side by side.
There are three organization pages:
- Overview: Key metrics, a table of your projects, and recent transactions across every app.
- Charts: The same charts as an app's Charts page, run over all your projects or one project.
- Projects: A searchable list of your projects. Click one to open its dashboard.
Requirements
- The organization pages are in the new dashboard at
app.superwall.com. - Any member of the organization can open them. If your access is limited to certain projects, you only see those projects, and their apps, in the totals, charts, and lists. See Project access.
Open the organization pages
When you sign in, Superwall opens the app you last used in the organization, or its only app. To get to the organization pages from an app:
- In the sidebar, click your organization's name at the top.
- Click Organization overview.
The sidebar now shows the organization's pages. Click Overview, Charts, or Projects to move between them. To go back to an app, click Choose project in the sidebar and pick a project.
Organization overview
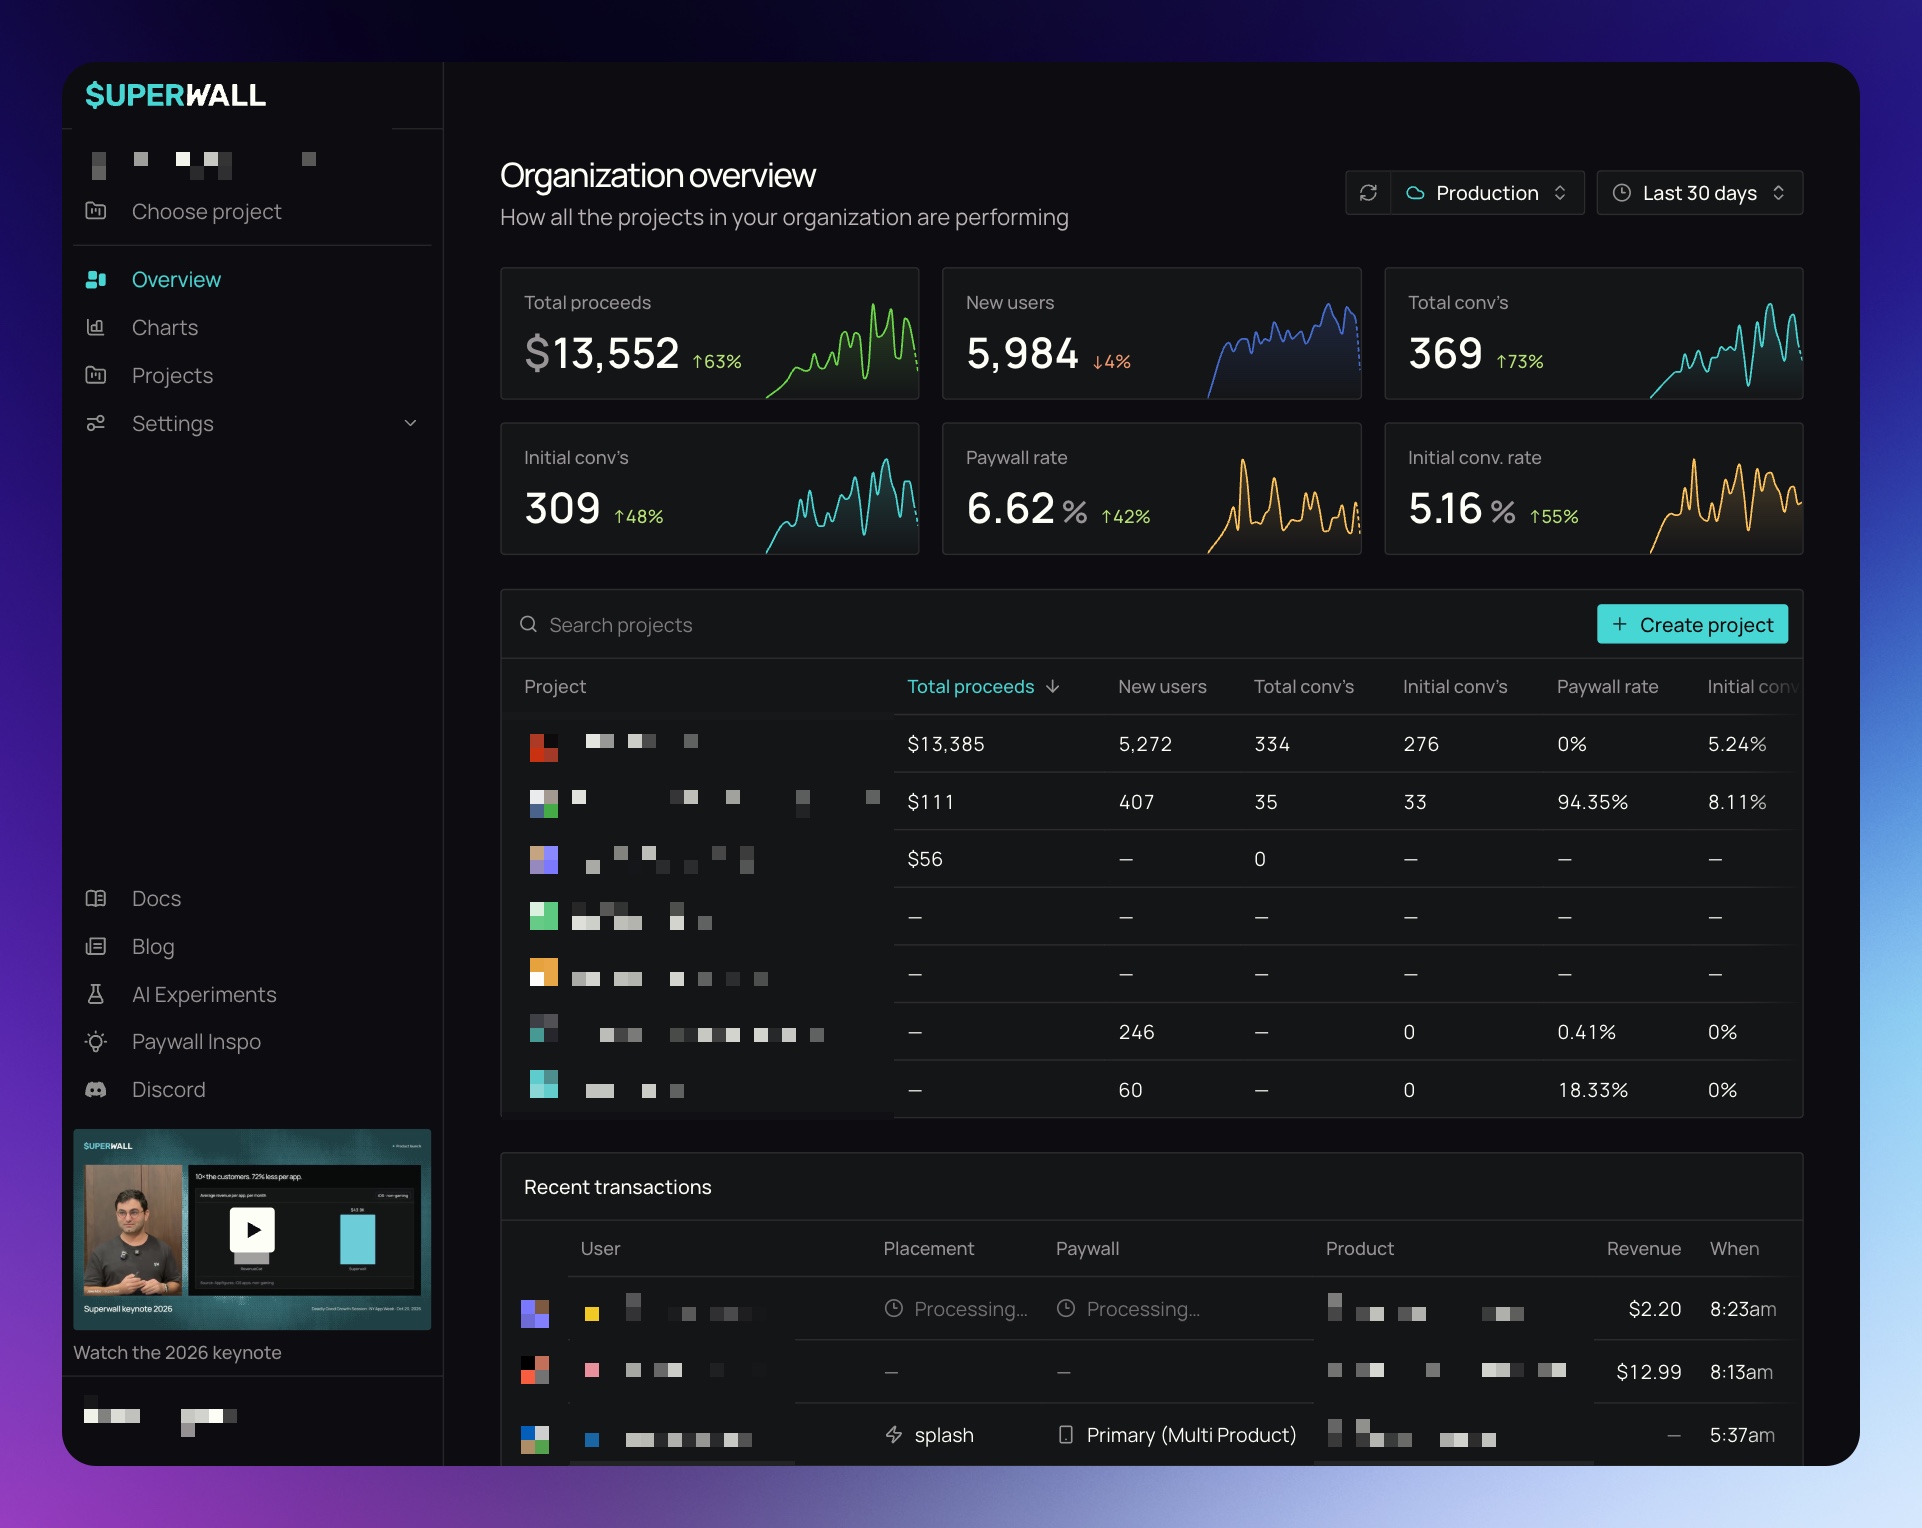
The Organization overview page shows how all the projects in your organization are performing.
Pick a date range and environment
The controls beside the page title change every number on the page.
- Choose a date range. The page starts on Last 30 days.
- Choose Production or Sandbox. The page starts on Production.
Metric cards
Each card adds up every app you can access and compares the total with the period before.
| Card | What it counts |
|---|---|
| Total proceeds | Net proceeds after refunds, taxes, and fees. |
| New users | New users who installed and opened your app in the selected period. |
| Total conv’s | All conversions on all paywalls in the selected period. |
| Initial conv’s | New users who converted on a paywall in the selected period. |
| Paywall rate | The percentage of new users who saw a paywall. |
| Initial conv. rate | The percentage of new users who converted on a paywall. |
Unlike the key metrics on an app's Overview, these cards don't open a chart when you click them. Use the organization Charts page instead.
Projects table
Below the cards, the projects table lists each project with the same six metrics for the selected date range and environment. Each row also shows the platforms the project has apps on.
- Projects are sorted by Total proceeds, highest first. Click any column header to sort by it.
- Type in Search projects to filter by project name or app name.
- Click a project to open its dashboard. Superwall opens its iOS app first, then Android, then web, and keeps the date range and environment you picked.
- A project with no apps you can open shows No available apps and can't be opened.
- Click Create project to add a new project.
Recent transactions
Recent transactions lists the latest transactions from every app you can access, for the selected date range and environment. Each row shows the app it came from, plus the same columns as the Recent transactions list on an app's Overview.
Organization charts
The organization Charts page has the same chart list, filters, breakdowns, chart formats, and export as an app's Charts page. The difference is which apps it reads: all your projects at once, or one project with all of its apps.
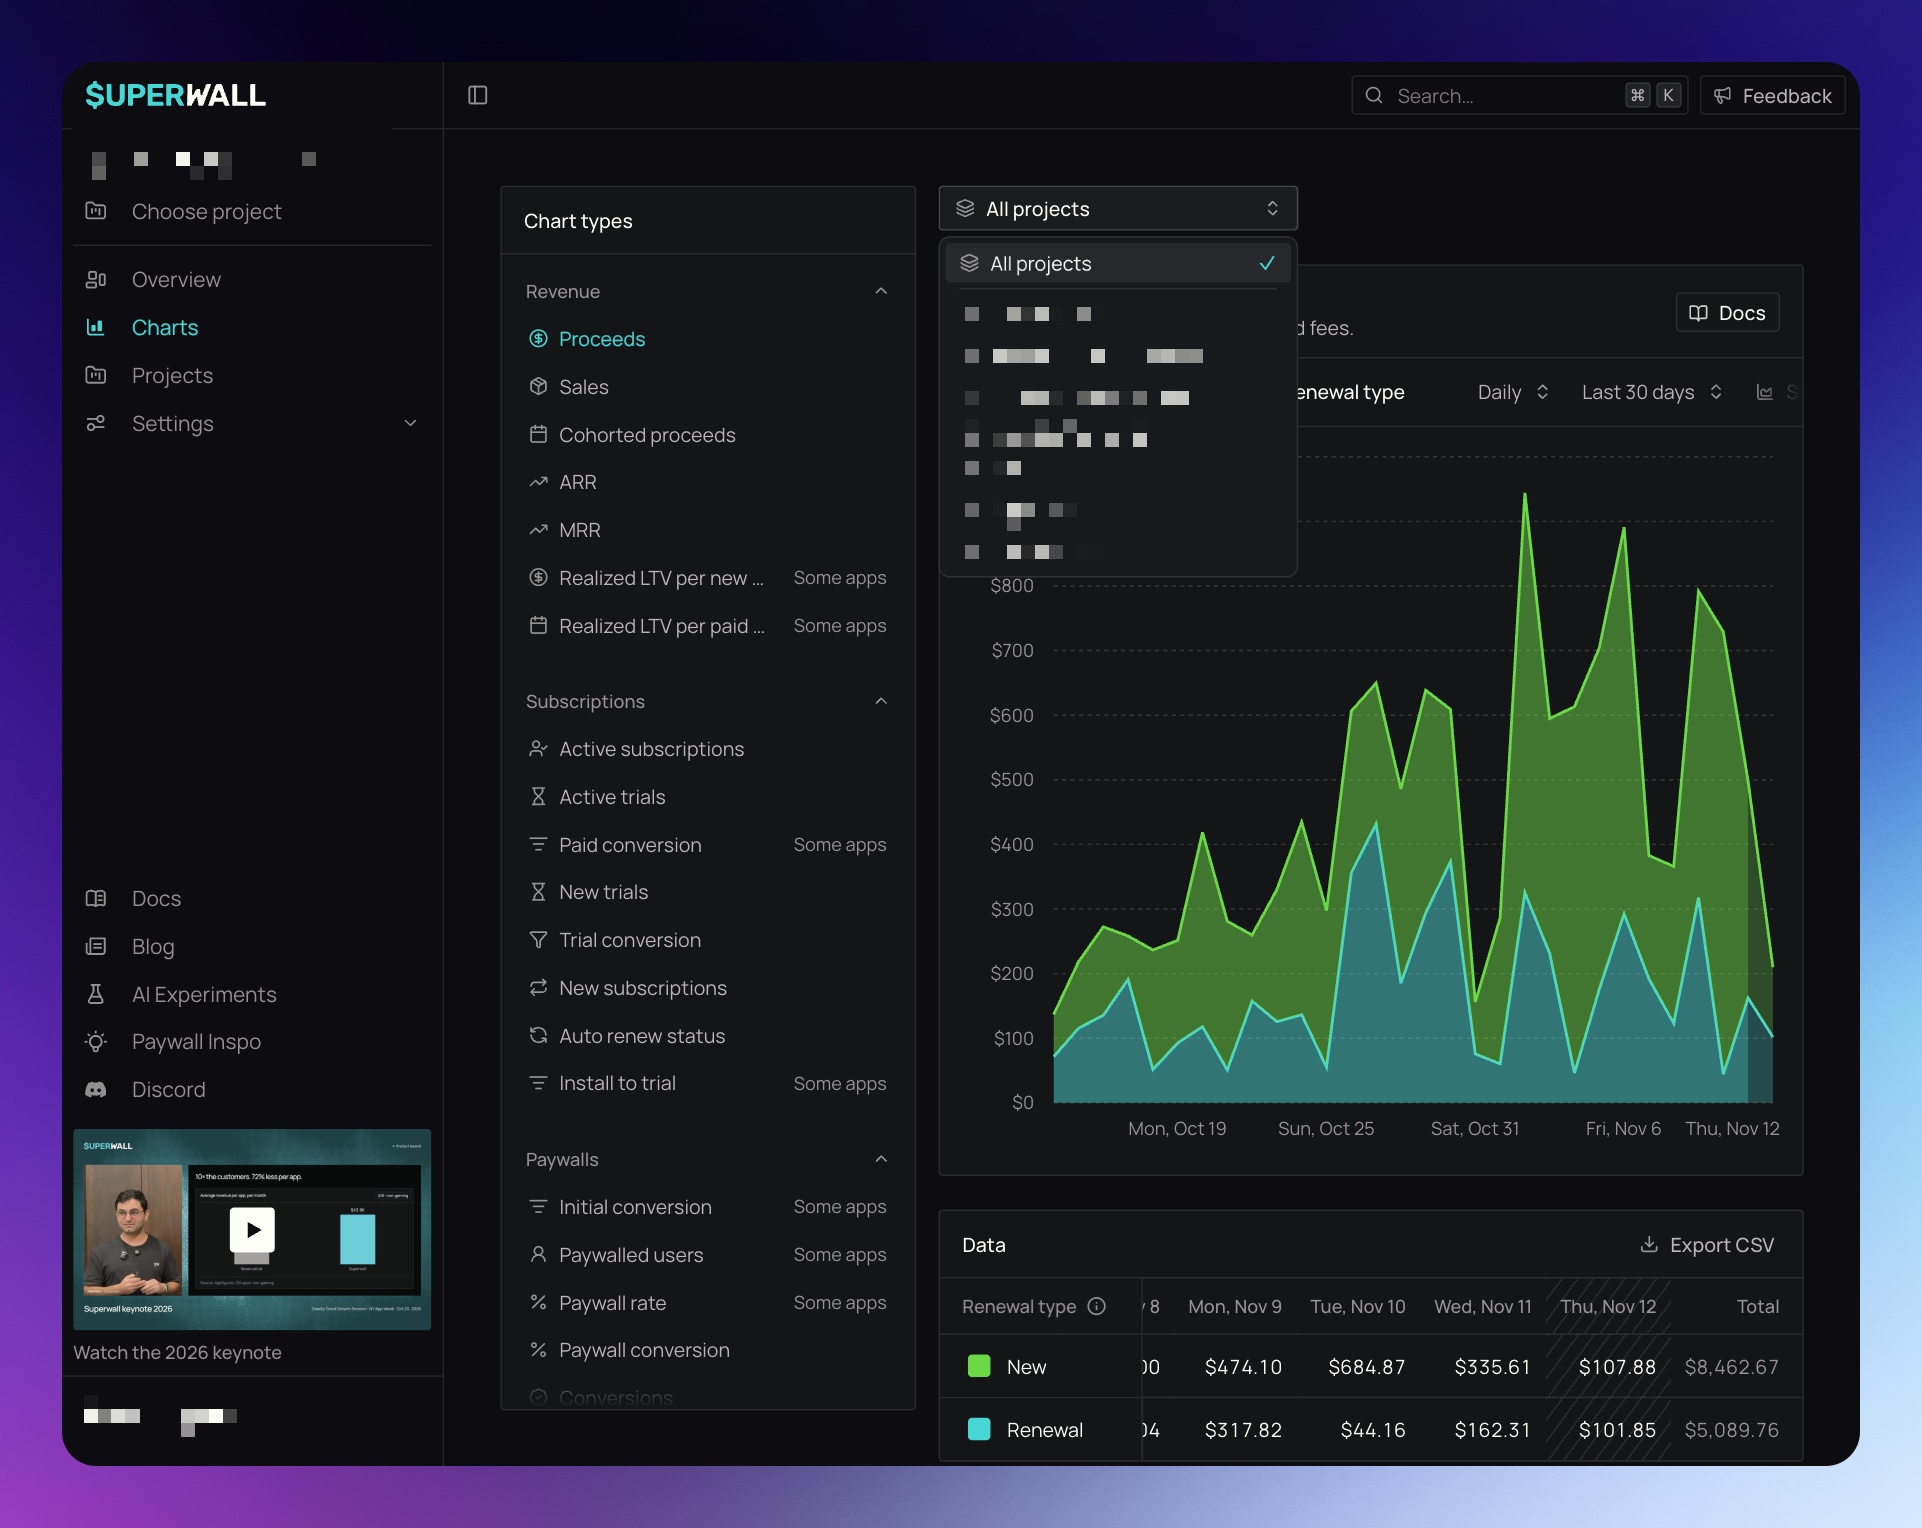
To chart one project:
- Click Charts in the organization sidebar.
- Click the scope picker above the chart. It starts on All projects.
- Choose a project.
To go back to every project, choose All projects in the same picker. If your access is limited to certain projects, this option reads All projects you can access.
When you switch scope, the chart, date range, environment, interval, and breakdown stay the same, unless the new scope doesn't offer that breakdown. Filters that point at one app's paywalls, campaigns, audiences, variants, placements, or products are cleared, since they don't apply to other apps.
How it differs from app charts
- App and Project breakdowns. You can break down a chart by App when it covers two or more apps, and by Project when those apps are in two or more projects.
- Revenue providers. Each app's revenue is counted from its own revenue source, so an app's numbers match what its own Charts page shows.
- Some apps. A chart that only some of the apps can have data for shows Some apps in the chart list. Above the chart, a note says how many apps it includes and why. For example, web apps have no installs, so user-based charts leave them out. Advertising charts only include apps with the ad integration.
- Unavailable. A chart that none of the apps can show is marked Unavailable and explains why instead of loading.
- One app at a time. Retention messaging and predicted LTV charts depend on one app's setup, so you can't run them here. Open them from the app's own Charts page.
- Product duration. The product duration breakdown and filter only appear when the scope has exactly one app.
- No annotations. Annotations belong to one app, so organization charts don't show them. See Annotating charts.
Projects
The Projects page is a plain list of every project you can access. Use it when you know where you want to go and don't need the metrics.
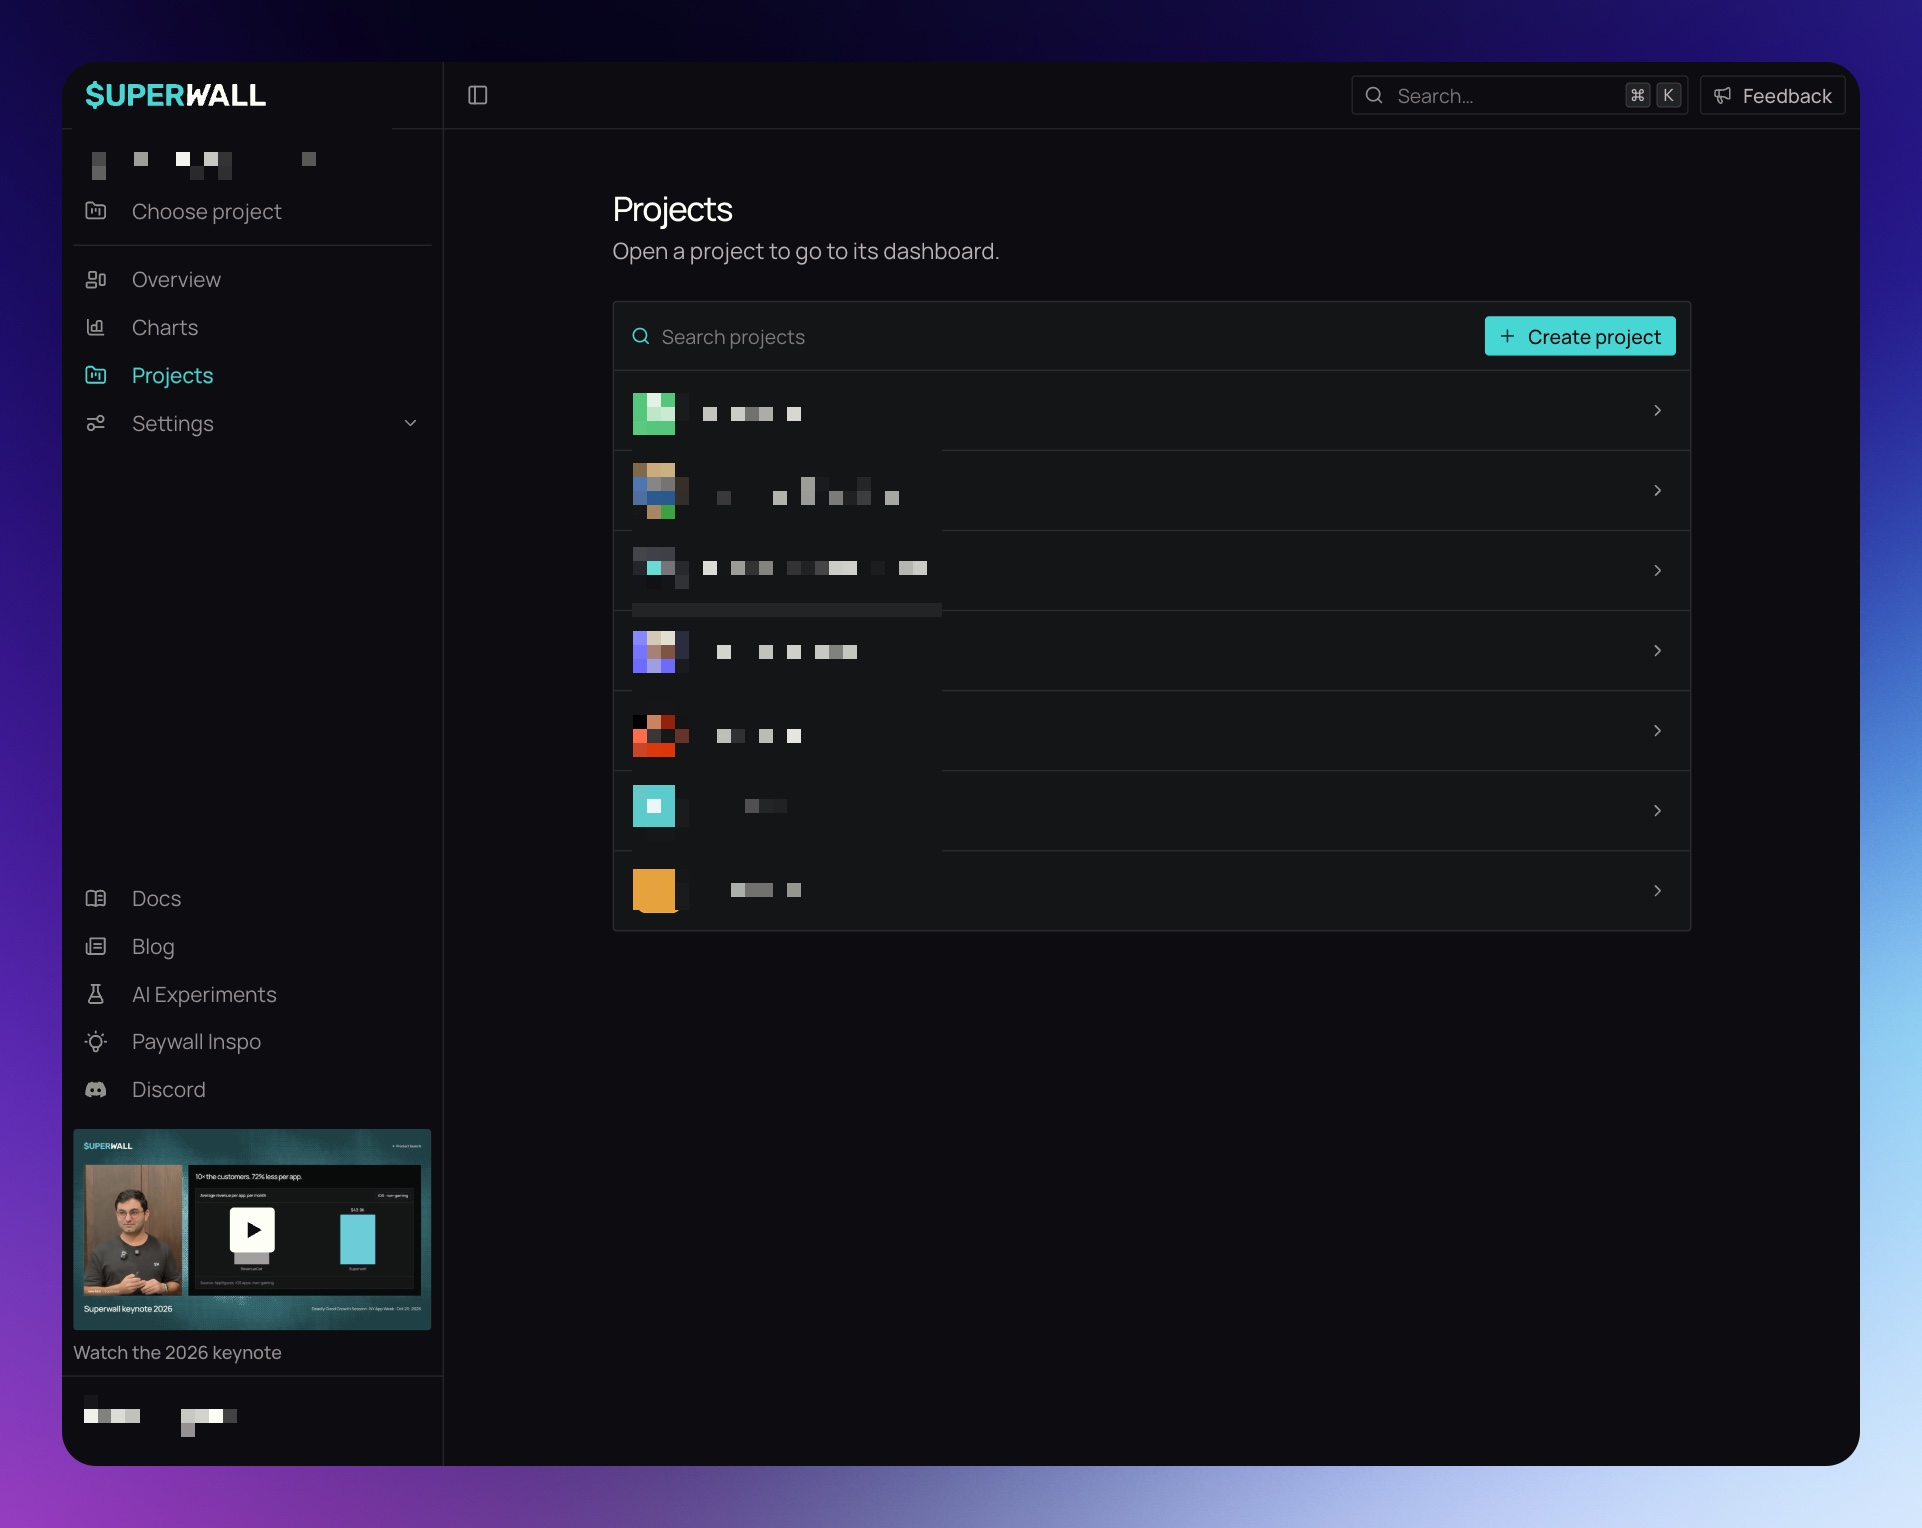
- Click Projects in the organization sidebar.
- Type in Search projects to filter by project name or app name.
- Click a project to open its dashboard.
You can also use the arrow keys to move through the list while the search field has focus, and press Enter to open the highlighted project. Click Create project to add a new one. To learn how projects group your apps, see Projects.
Limitations
- Totals, charts, and lists only include projects and apps you have access to.
- The metric cards on the organization Overview don't link to charts.
- Retention messaging and predicted LTV charts aren't available at the organization or project level.
Related
How is this guide?