Charts
Conversions
Learn what the Conversions chart measures and when to use it.
What it shows
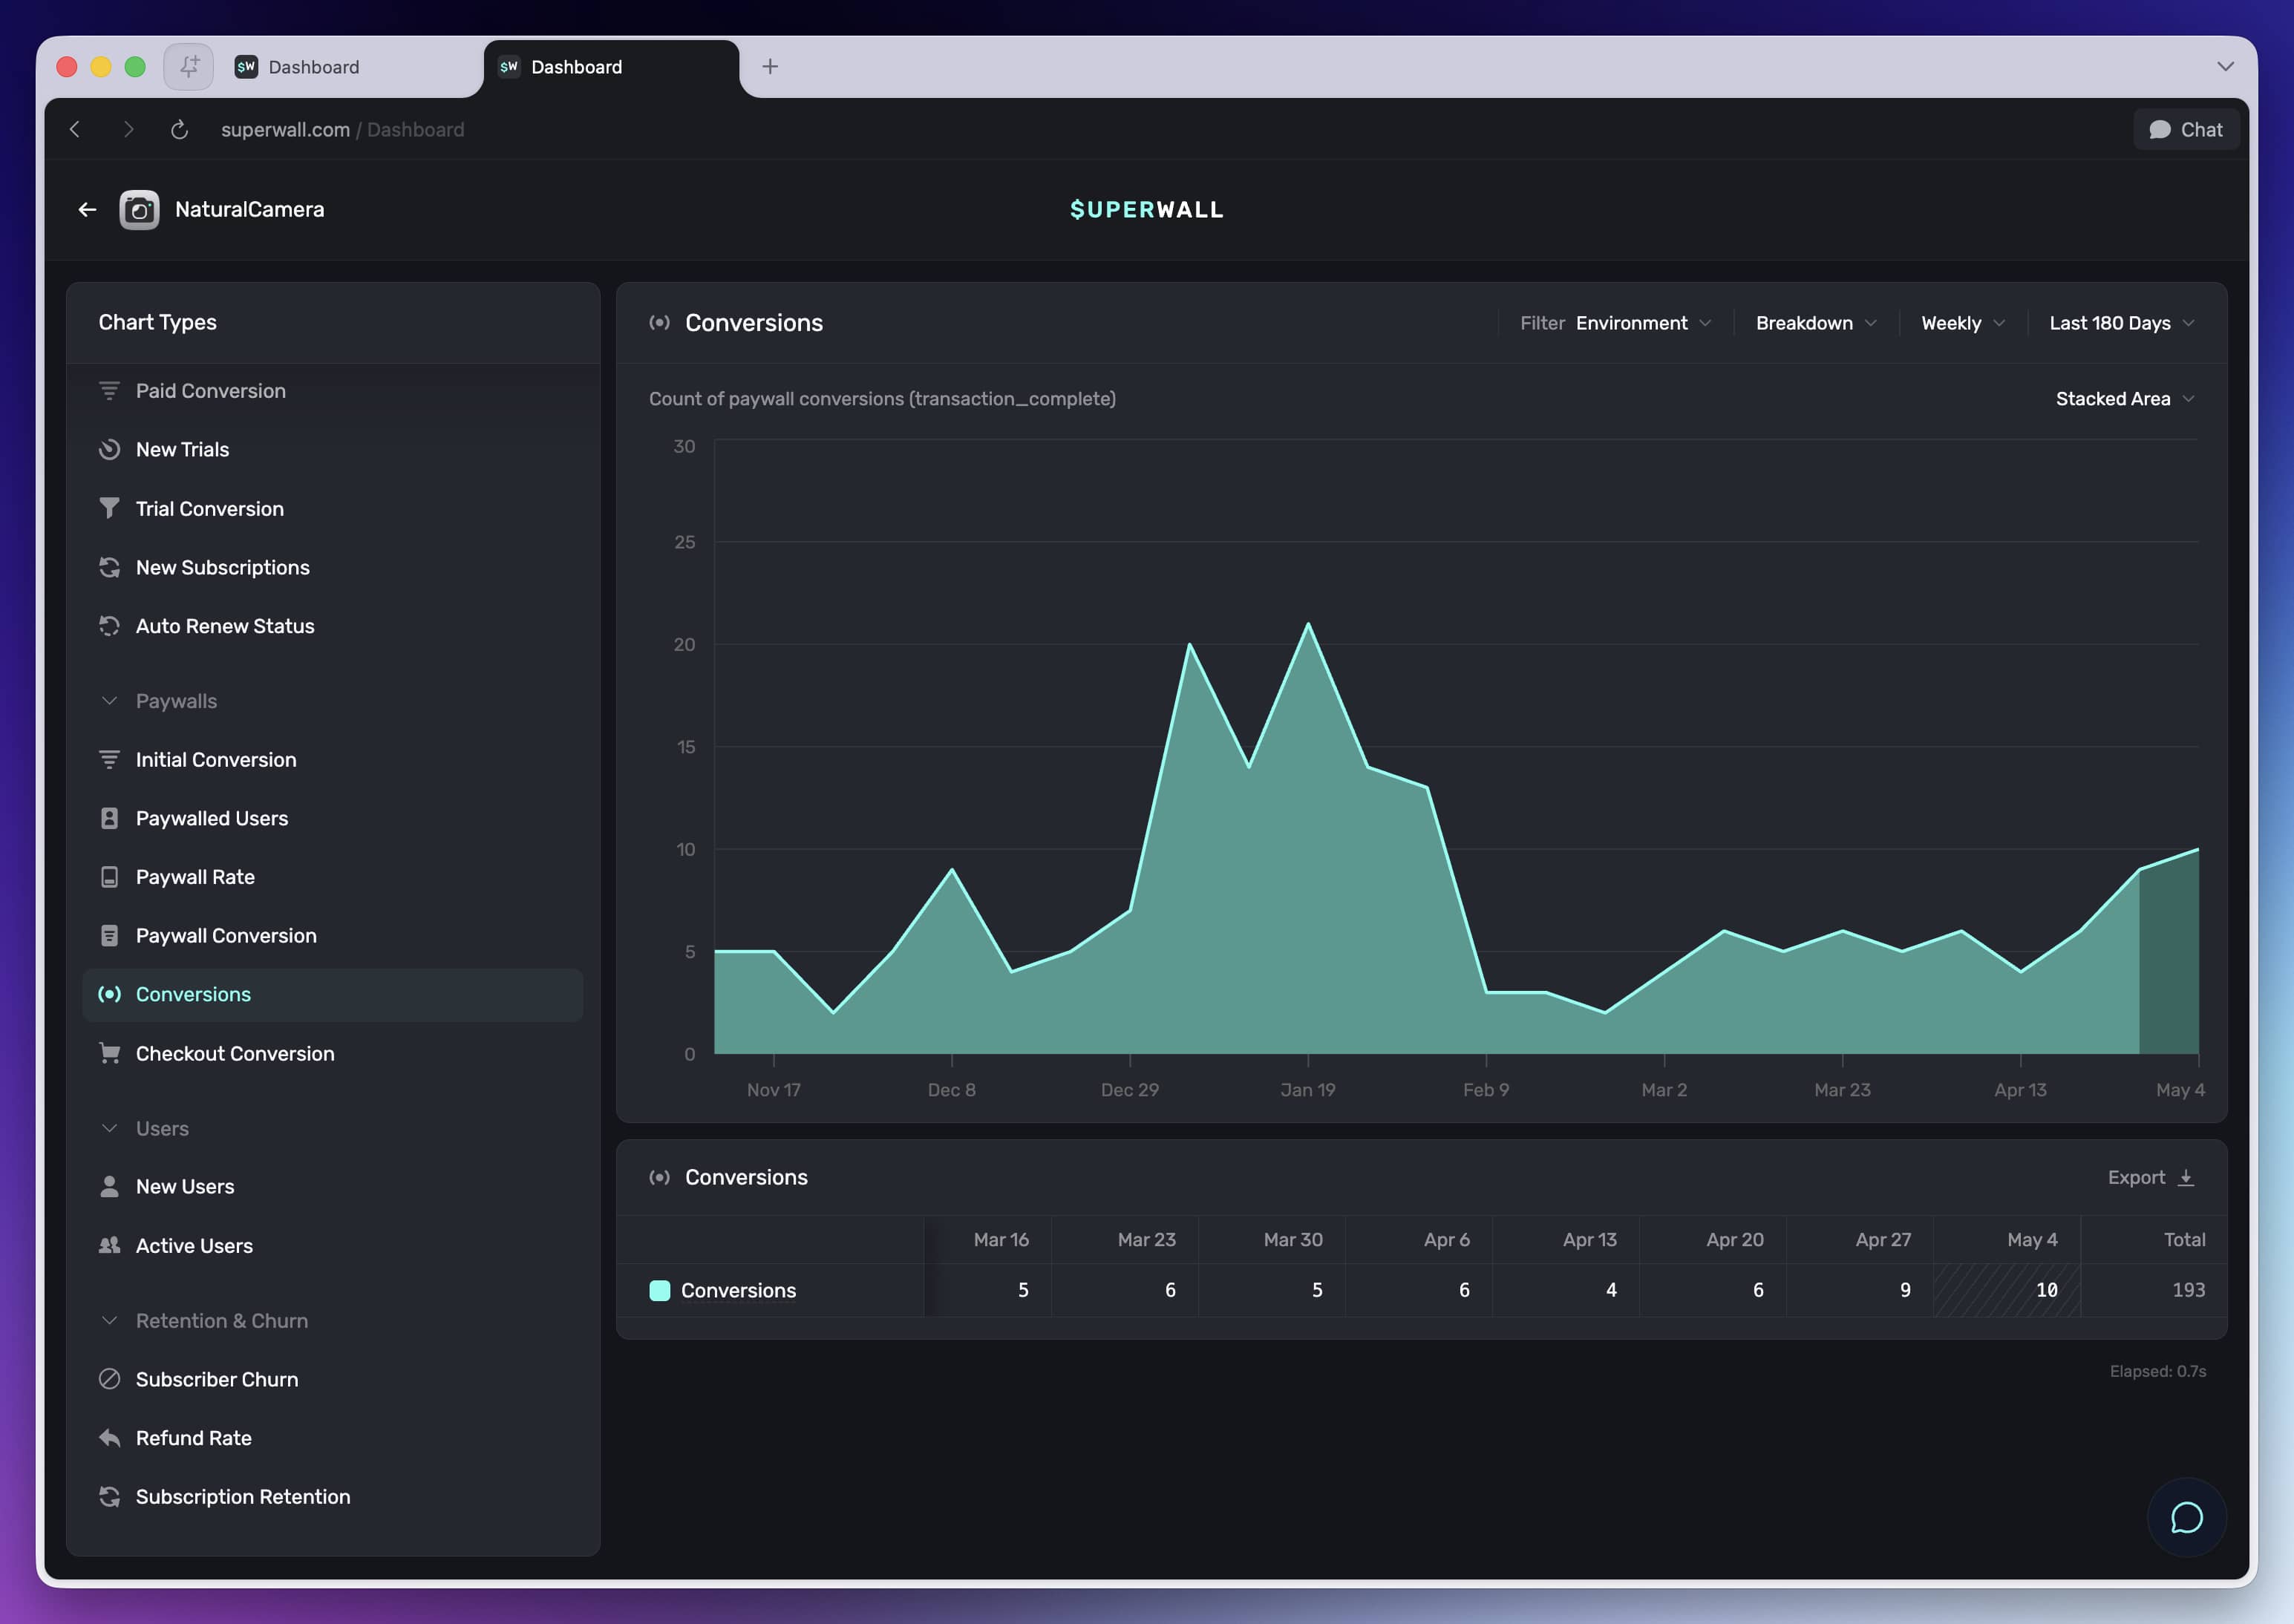
Conversions shows the count of completed transactions.
How to use it
Use this chart to track purchase volume over time. It is useful for reviewing campaign launches, product changes, offer changes, and seasonal traffic patterns.
Good to know
Conversion count is volume, not rate. Pair it with Paywall Conversion and New Users when you need to understand whether performance changed because of traffic or efficiency.
How is this guide?