Charts
Realized LTV per new user
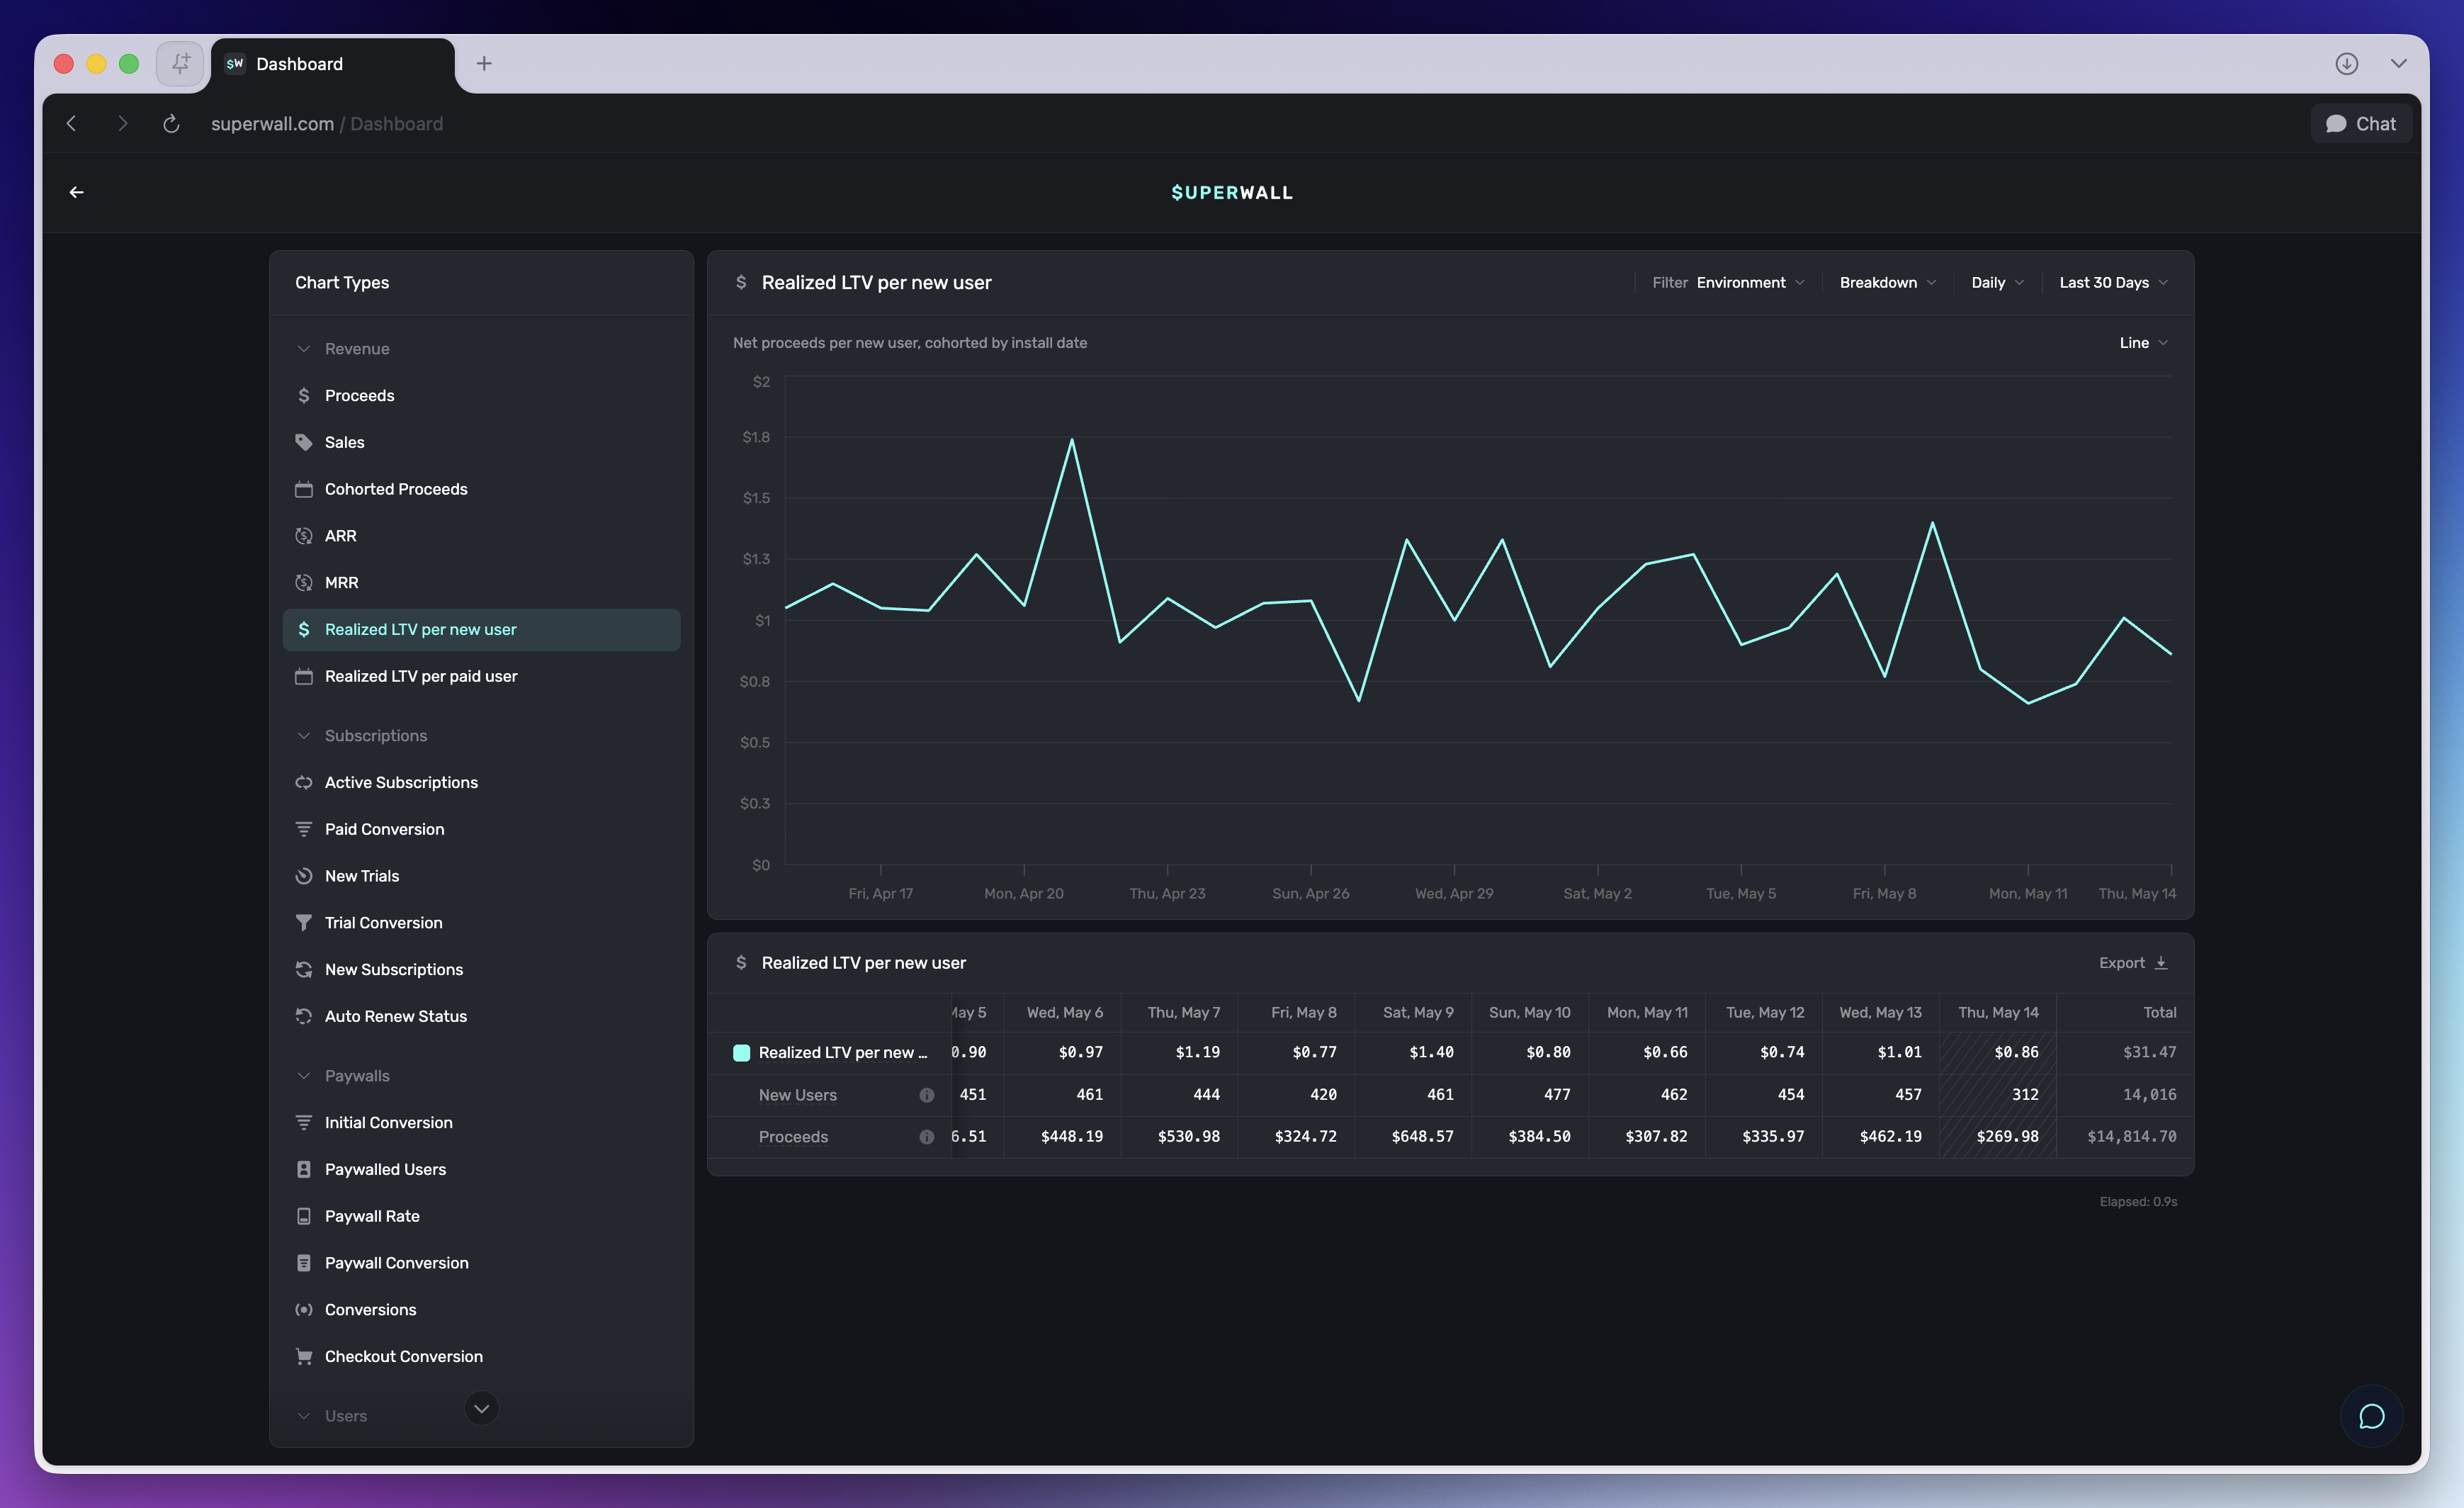
Learn what the Realized LTV per new user chart measures and when to use it.
What it shows
Realized LTV per new user shows net proceeds per new user, cohorted by install date.
How to use it
Use this chart to understand how much revenue new users have actually generated so far. It is useful for evaluating acquisition quality, pricing changes, and onboarding or paywall changes across install cohorts.
Good to know
Newer cohorts have had less time to generate revenue, so compare them carefully against older cohorts.
How is this guide?