Debugger
To view the paywall debugger, click the Debugger button from the sidebar
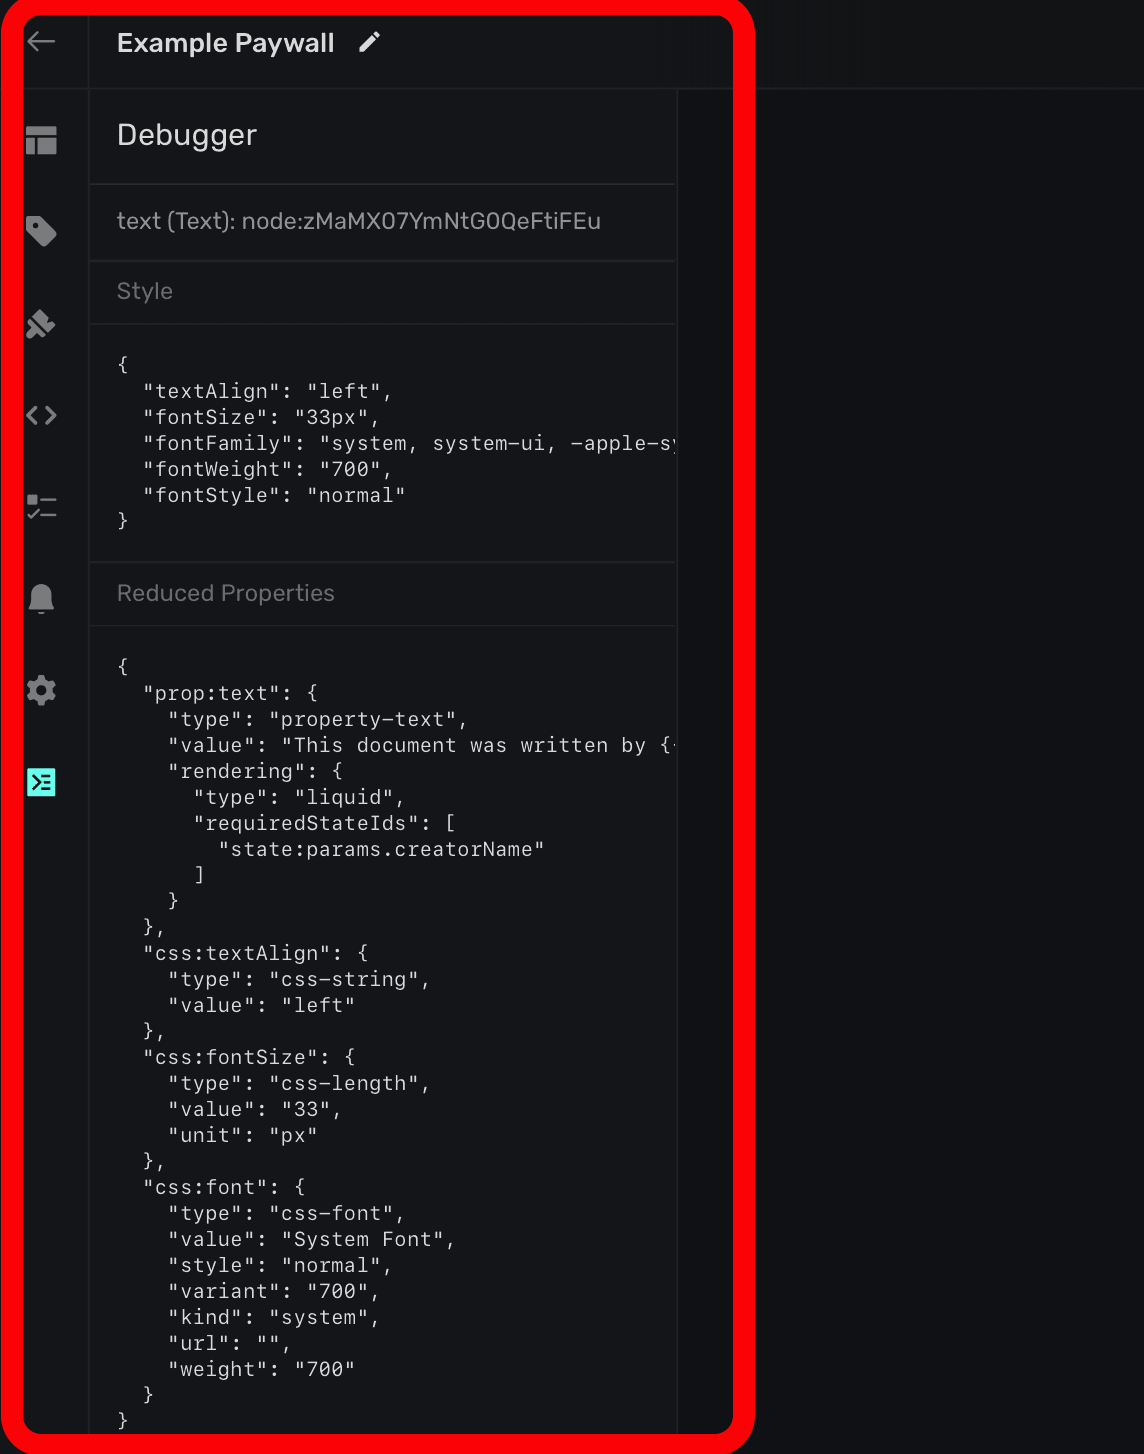
The debugger shows a raw representation of selected components. This is useful if you're trying to debug layouts or designs, since the CSS Superwall is generating will show here. It also will show what variables are applied and what they're specifically being evaluated to.
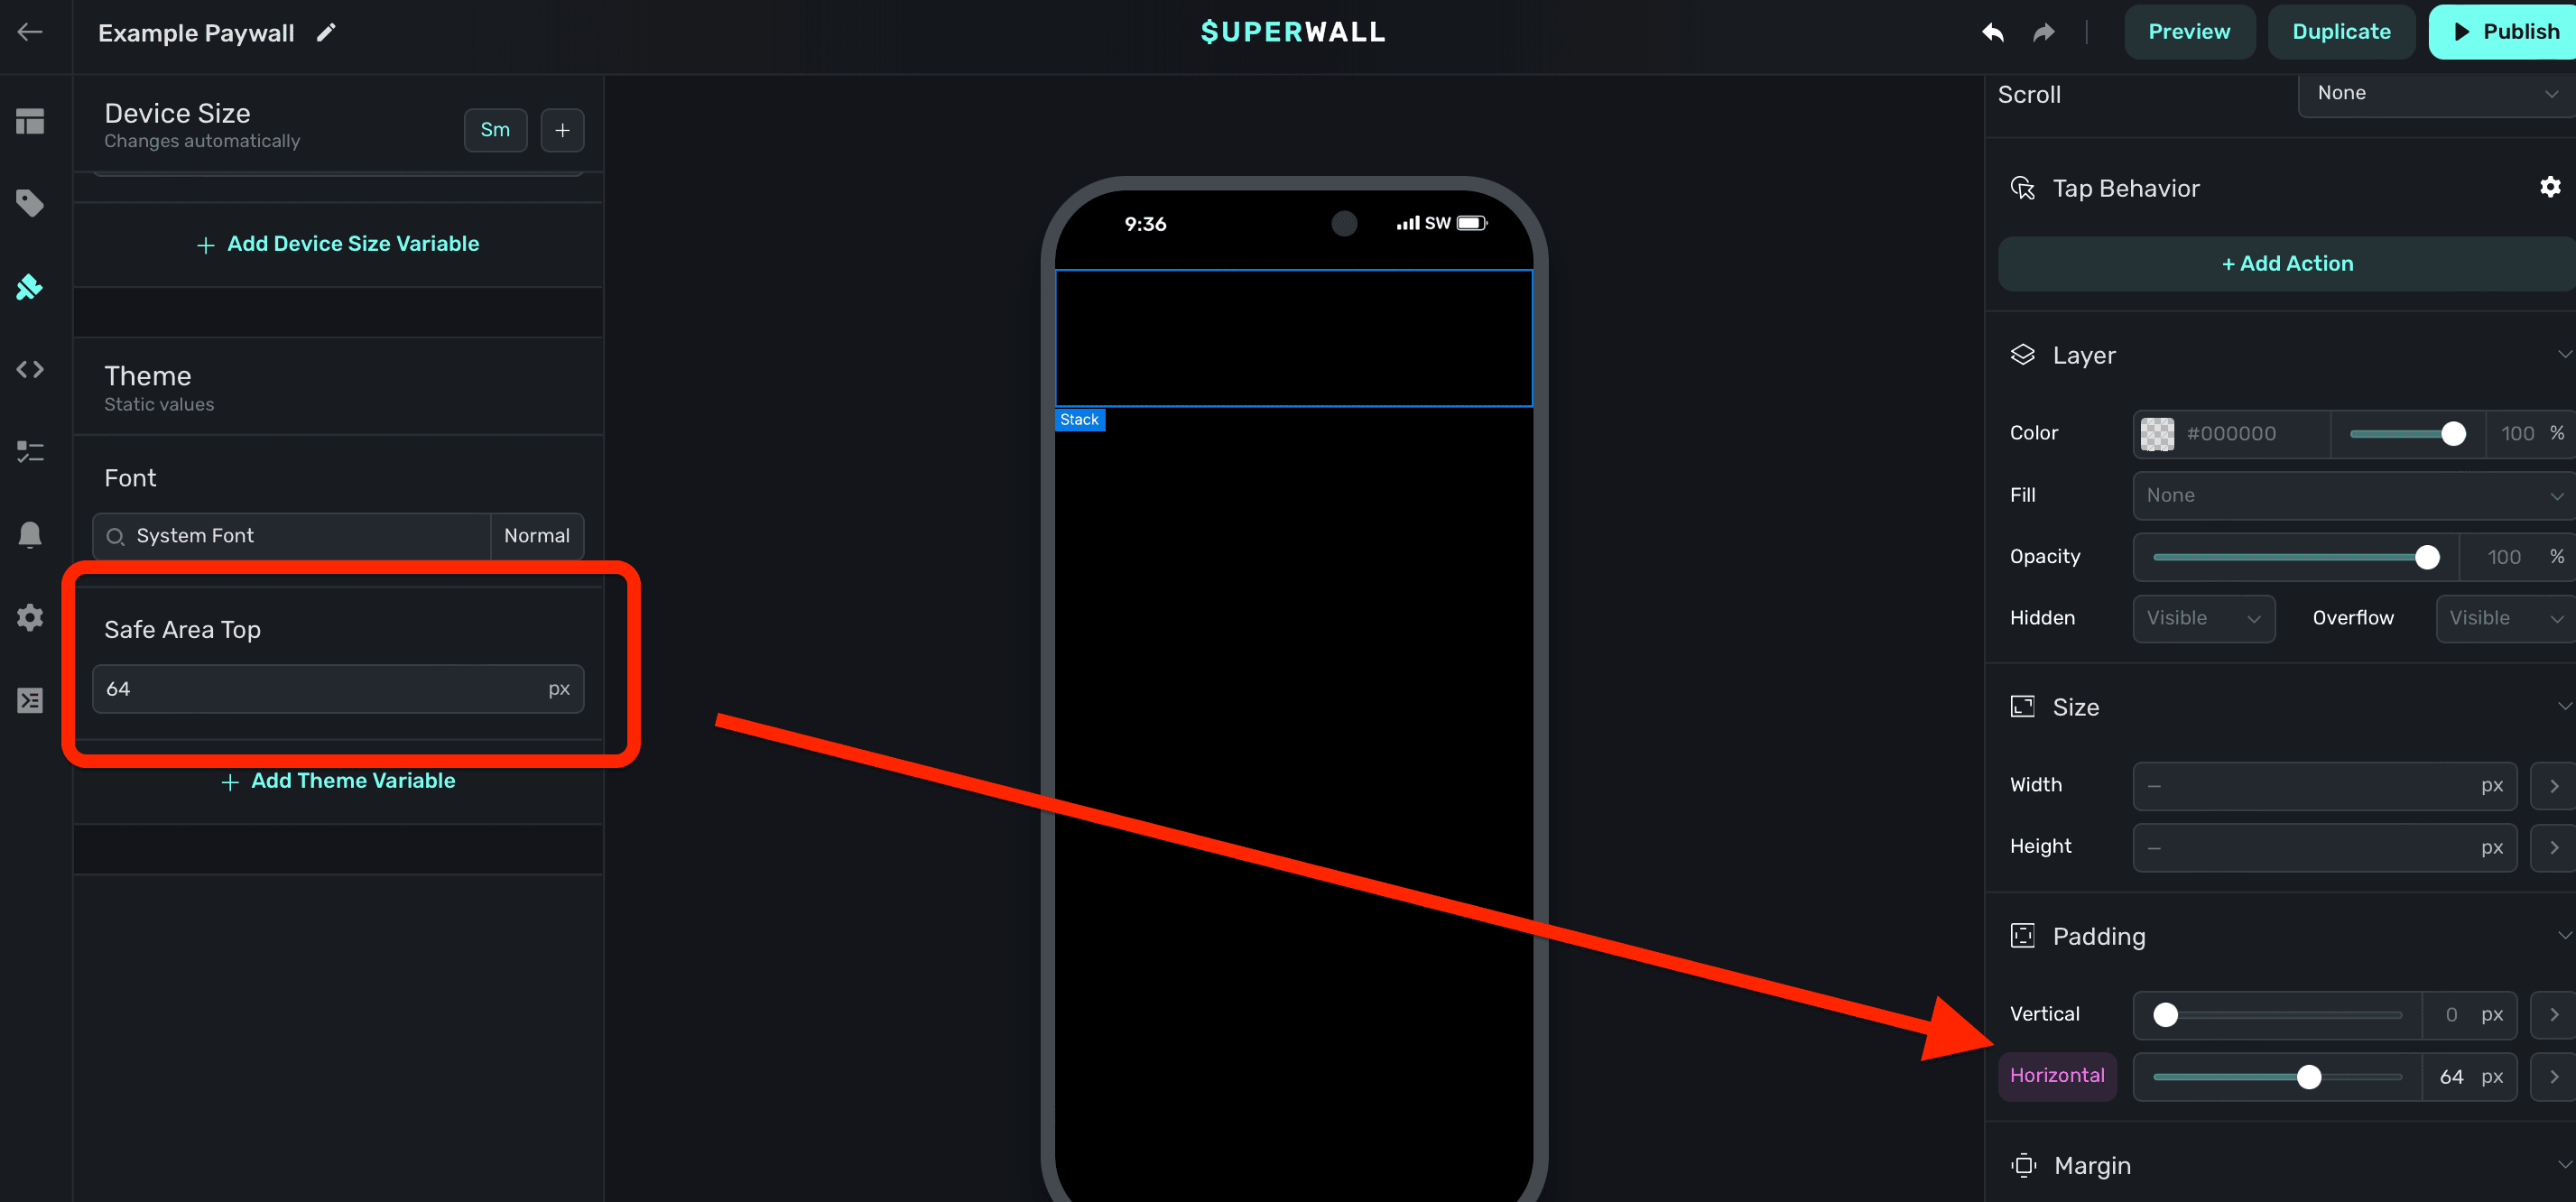
In this example, there is a variable called "Safe Area Top", set to 64 pixels. It's been set to the component's horiztonal padding for demonstration purposes:
When the component is selected, and the debugger is opened — you can confirm that variable is being applied to the component's padding:
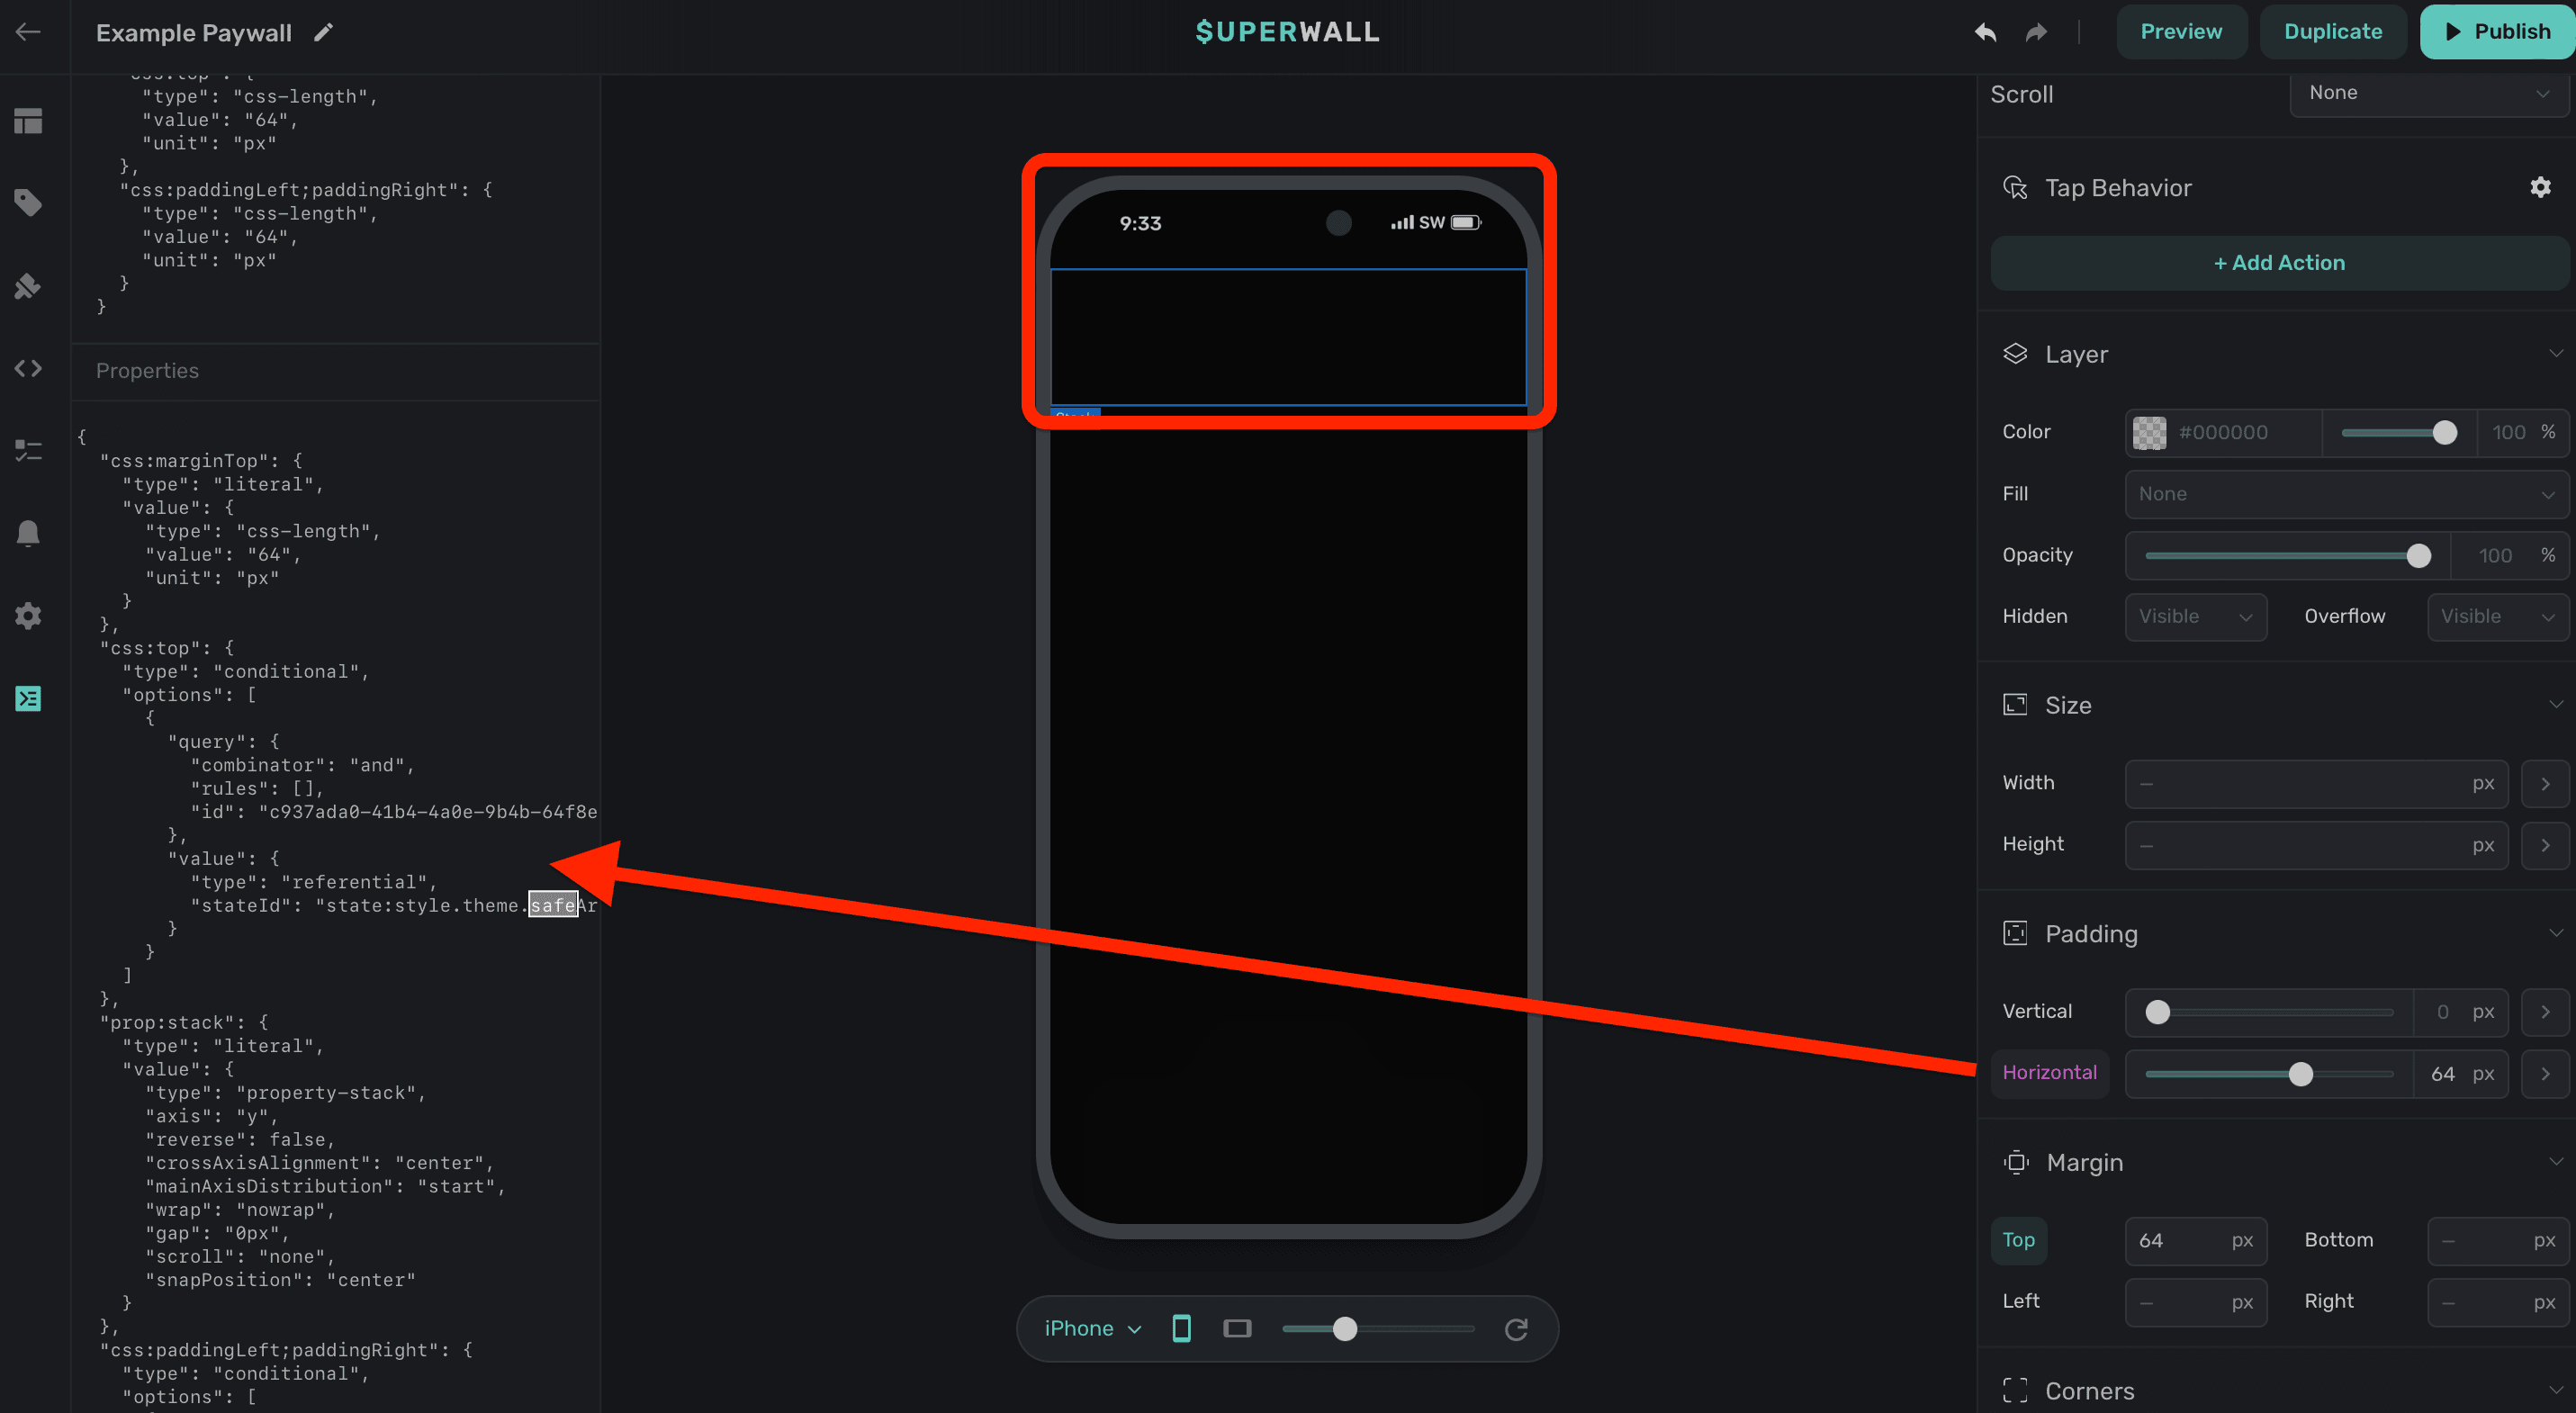
If you're unsure of why a paywall has a design quirk or isn't displaying as you'd expect, open the debugger and take a look at the CSS.
How is this guide?